Join 43,000+ fleet owners tracking smarter.

Start Freeor book a live demo
AVLView

GPS fleet tracking trusted by 43,000+ fleet owners worldwide. Automate operations, cut costs, and scale effortlessly.

GDPR Compliant
Singapore • 11 Countries Worldwide
Philippines•India
support@avlview.com
+65 8228 4559

Fleet tips, straight to your inbox

No spam, unsubscribe anytime.

support@avlview.com+65 8228 4559
Product
  • Fleet Tracking
  • Driver Safety
  • Fuel Monitoring
  • Maintenance
  • Geofencing
  • Landmarks & POIs
  • Reports & Alerts
  • Fleet Capacity
  • API Integration
Solutions
  • Partner Program50-75% margins
Resources
  • Blog
  • Help Center
  • API Reference
Company
  • About Us
  • Become a Partner
  • Contact
  • Pricing
Locations
  • Dubai
  • Riyadh
  • Singapore
  • India
  • Philippines
  • USA

© 2026 AVLView. All rights reserved.

Privacy PolicyTerms of ServiceEULACookie Policy

We use cookies to improve your experience and analyse site traffic. Cookie Policy

AVLView
Pricing
🇸🇬+65 8228 4559
العربيةLogin
Getting Started
Alerts & Reminders
Maps & Geofencing
Supported Devices
Reports
  • Reports Overview
  • Vehicle Timeline
  • Fleet Activity
  • Trip - Ignition/Stoppage
  • Live Fleet Status
  • First Movement
  • Unplanned Stoppage
  • End of Day Fleet Summary
  • Speeding
  • Driver Safety & Performance
  • Driver Hours & Shift Compliance
  • Driver Cost & Liability
  • Fleet Cost Per Kilometre
  • Idle Time Ranking
  • Fuel Anomaly & Theft Detection
  • POI Visit
  • Geofence Breach
  • Compliance & Liability Exposure
  • Fleet ROI & Utilisation Score
  • Maintenance Cost vs Vehicle Age
  • Asset Performance Scorecard
  • Temperature Overview
  • Temperature Exceptions
  • Cold Chain Certificate
  • Crane Usage
  • Equipment Usage
  • Security Events
  • Fleet P&L Summary
Analytics
Service & Maintenance
Trip Scheduling
Dashboard
Settings & Admin
Troubleshooting
What's New
Reports
Published Jul 2026

Temperature Overview

On this page

  • What the report shows
  • How to run it
  • Schedule it
  • Frequently asked questions
  • Related reports

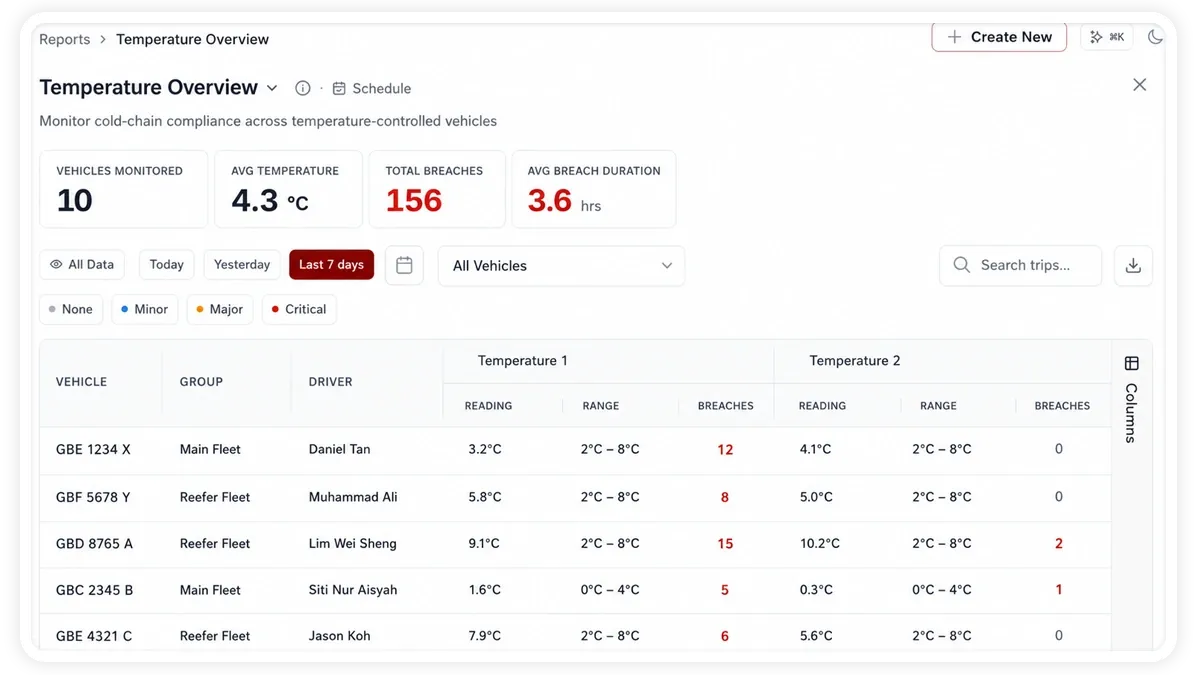
The Temperature Overview report summarises the readings from the temperature sensors fitted to your refrigerated vehicles. It is built for cold-chain operators who need a quick, fleet-wide picture of how well cargo temperatures are being held.
🖼️ IMAGE PLACEHOLDER — supplied by design

Dimensions: 1200 × 900 px (4:3) · PNG or WebP · under 200 KB

Shows: The Temperature Overview screen with a row per vehicle showing average, maximum and minimum temperature columns, breach count and average breach duration.

Alt text: AVLView Temperature Overview report listing average, maximum and minimum temperatures and breach counts per vehicle.

What the report shows

For each monitored vehicle, and across the fleet as a whole, the report brings together the key temperature figures for the period you choose:

  • Avg Temperature — the mean reading across the period, showing the temperature the load was typically held at.
  • Max Recorded — the highest temperature seen, useful for spotting warm spikes.
  • Min Recorded — the lowest temperature seen, useful for spotting over-cooling or freezing risk.
  • Breaches — the number of times a reading moved outside the allowed range for that vehicle.
  • Vehicles Monitored — how many vehicles reported temperature data during the period.
  • Avg Breach Duration — the average length of a breach, showing how long the load stayed out of range each time.

How to run it

  1. Open Reports and choose the Sensors & Add-ons category (or search “temperature”).
  2. Select Temperature Overview.
  3. Set the date range you want.
  4. Click View to see it on screen, or Download for a PDF or Excel copy.

Schedule it

Use the Scheduled tab to have the Temperature Overview emailed to you automatically — a daily or weekly summary keeps quality and compliance teams updated without anyone running it by hand.

Frequently asked questions

What hardware does this report need?

Each vehicle must have a temperature sensor add-on wired to its AVLView tracking device. Vehicles without a sensor will not appear in the report.

Why does a vehicle show breaches?

A breach is counted whenever a reading moves outside the allowed temperature range set for that vehicle. To see exactly when and why breaches happened, use the Temperature Exceptions report.

Related reports

  • Temperature Exceptions
  • Cold Chain Certificate
Next
Temperature Exceptions
Drill into every cold-chain breach event — which vehicles went out of range, whether a door opening was to blame, and how long recovery took.
Continue

Learn more about this feature

Explore feature

More in Reports

  • Reports Overview
  • Vehicle Timeline
  • Fleet Activity
  • Trip - Ignition/Stoppage
  • Live Fleet Status
Didn't find what you needed?Contact support

In this guide

  • What the report shows
  • How to run it
  • Schedule it
  • Frequently asked questions
  • Related reports
Need a hand?

Talk to our team in your language.

Contact support