Nightly report delivered daily
Create vehicle tracking reports on the fly
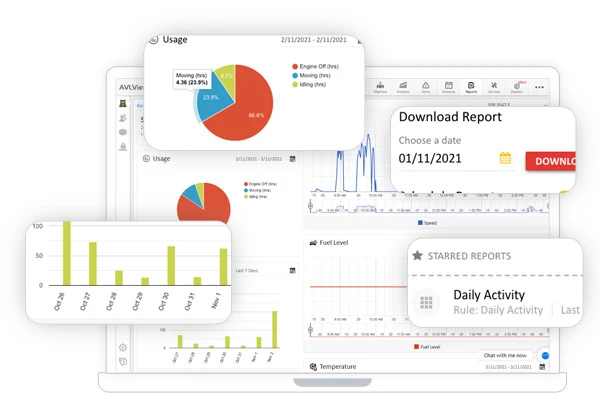
20+ charts and nearly 50+ concise vehicle tracking reports, all brief yet highly informative.
Read more: Fleet reporting
Ad-hoc, meaningful GPS tracking reports do the sorting
- It gives you valuable insights
- Increase top-line revenue.
Tune every view to fit your fleet operation
Set up views, work with your data, and make it meaningful. View colour-coded live, past vehicle tracks on your vehicle tracking app and share actionable information.
- On the fly
- Templates
- Scheduling
- Activity based
- Chart
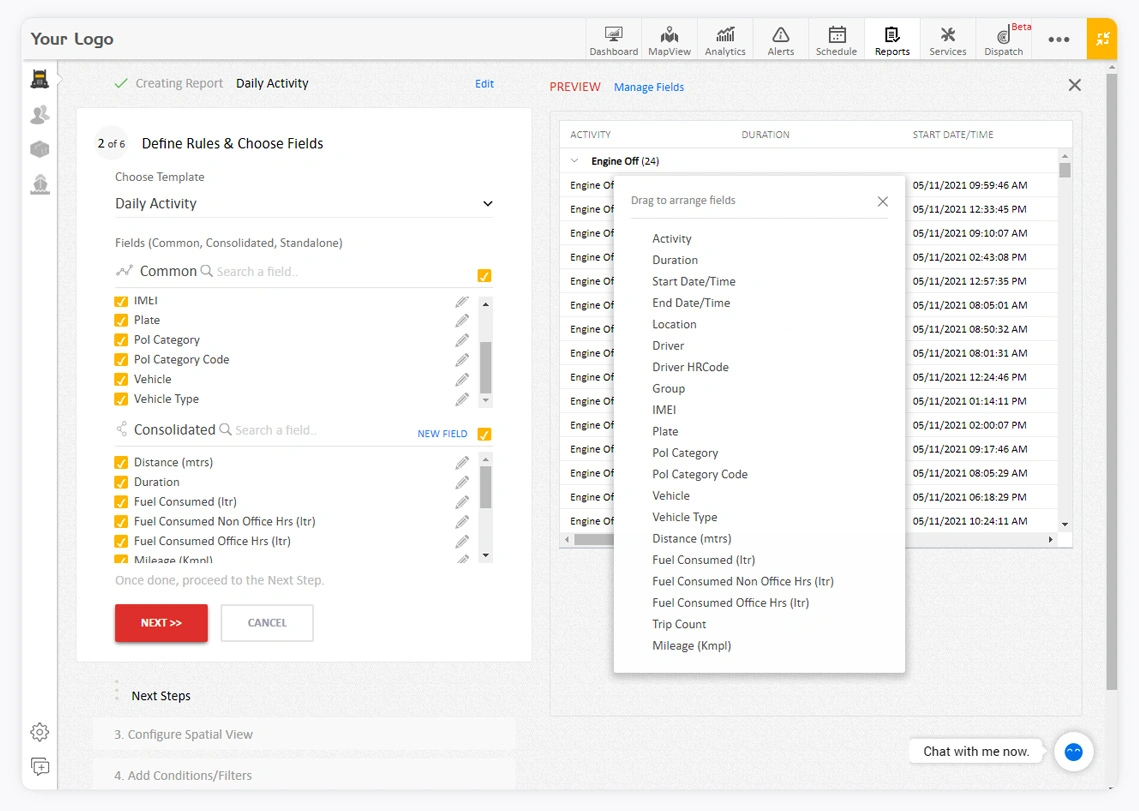
Fleet intelligence at your fingertips
With charts and concise reports, all brief yet highly informative, you have all the
information at your fingertips for making smart business decisions quickly.
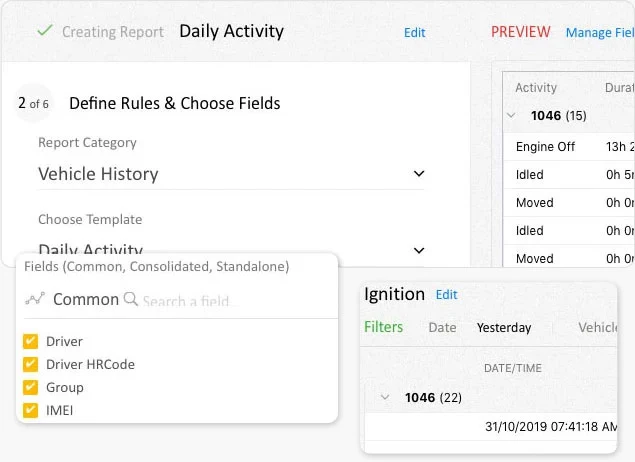
Create fleet reports on the fly (Ad Hoc)
It helps you to get up-to-the-minute insights into data that a normally scheduled report can not provide.
The ad-hoc wizard can be used by everyday business users with no technical background at all
- Produce reports fast, with near-to-real-time data, and your own parameters;
- Be agile, dynamically modify the report template;
- Delve into your data to find out anything you want even when fleet move.
- Generate and download huge report data in seconds.
Generate vehicle tracking reports with predefined template
As many as 20 inbuilt reports template to choose from based on criteria that suit generic fleet operation.
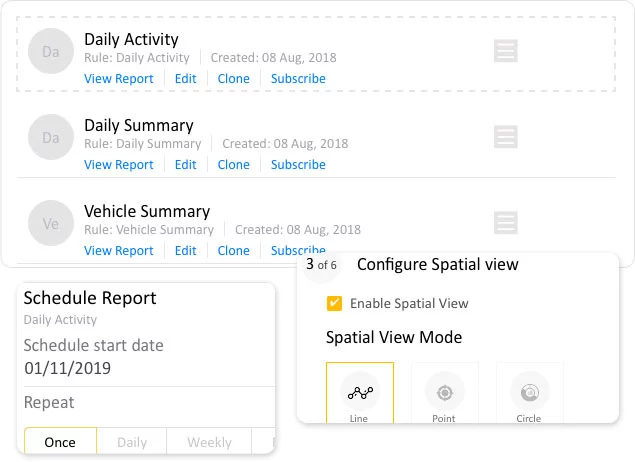
- Customize the report template;
- Clone a report template;
- Schedule reports;
- Drag, drop report fields;
- Export report in Excel or PDF format;
- Access to past report data for 12 months;
Group by entity and attribute
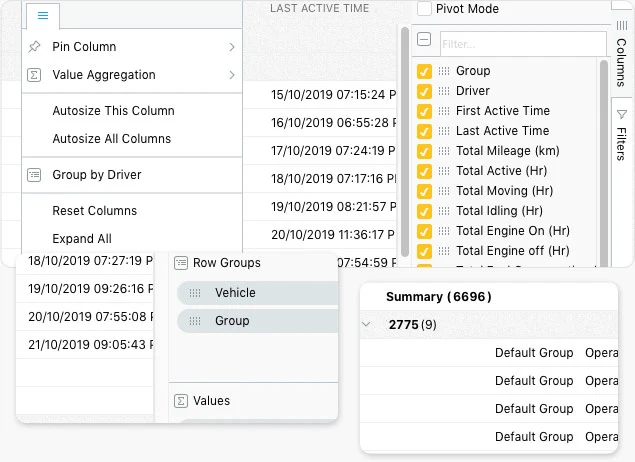
You may group the entities on the report grid based on multiple criteria, such as vehicle, date, events. In addition, you can format the report grid viz..
- Pin columns;
- Do Value Aggregation (e.g. SUMMARY);
- Drag and move a column to left or right;
- Auto size all or specific columns;
- Expand or collapse the summary.
Trip based GPS tracking reports
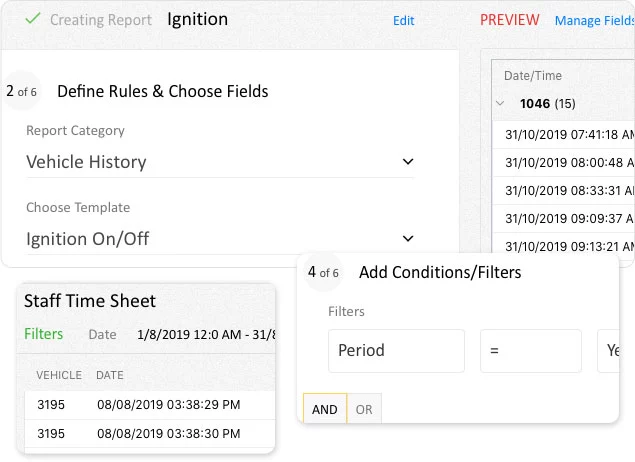
You may define a trip based on considering how the journey ends. E.g., Ignition On -> Ignition Off or Ignition On -> Vehicle stops for, say 5 minutes.
Trip based GPS tracking reports are categorized as follows;
- Daily summary report;
- Ignition or stoppage;
- Points of Interest (PoI);
- Transit;
- Staff timesheet;
- Ignition On/Off;
- Vehicle summary.
Stoppage and/or Idling reports
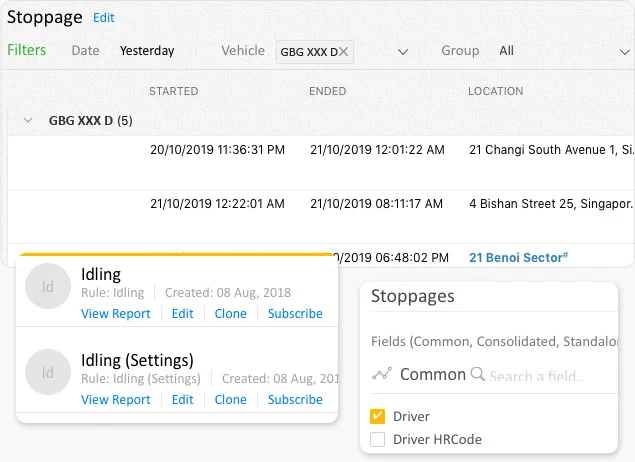
Insights on stoppages and Idling instances made by your vehicles; where exactly did the vehicle stop or idle, for how long and with the timestamp.
- Stoppage;
- Stoppage (Settings);
- Idling;
- Idling (Settings).
Reports on driving violations
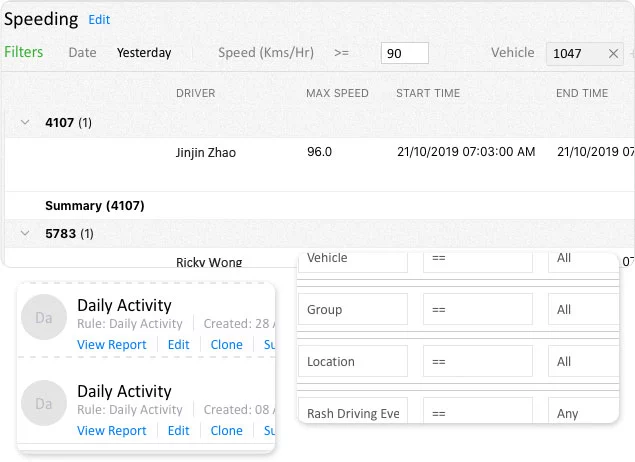
Such reports are based on different driving violations committed by drivers viz;
- Speeding incidents;
- Driving without wearing a seatbelt;
- Reckless driving offences;
- AC misuse;
- Trailer door (open/close) events.
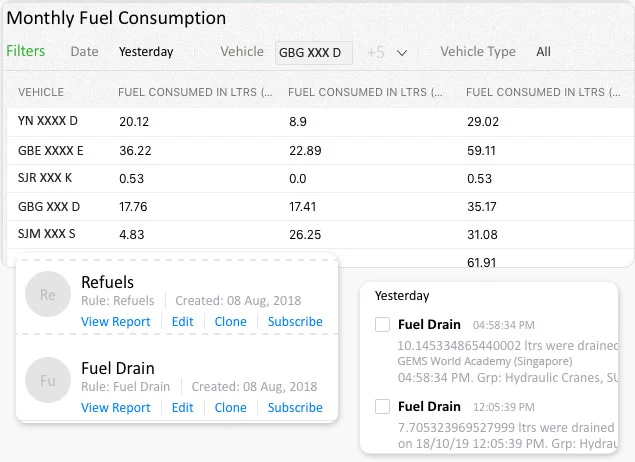
Fuel Reports
Simple and easy reports based on fuel consumption, refuel and drain.
- Monthly Fuel Consumption;
- Refuel reports;
- Fuel drain;
- Fuel consumption (based on refuel data).
Other useful reports
Based on your criteria, GPS tracking reports (GPS report pdf) provide an overview of all vehicle activities.
- Reports based on daily activity;
- Reefer temperature;
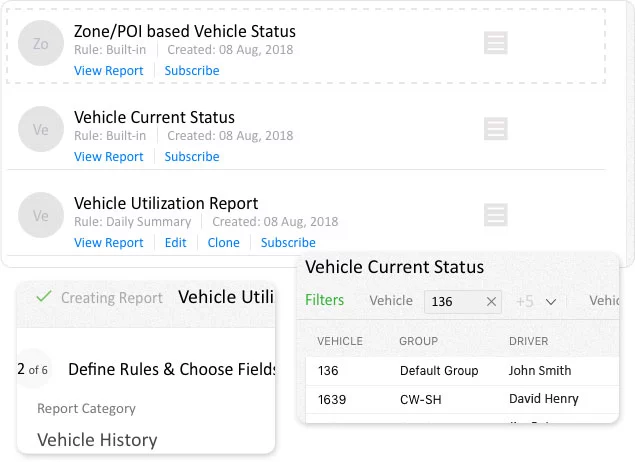
- Vehicle utilization report;
- Zone or PoI based on vehicle Status;
- Territorial fence entry and/or exit;
- Trash collection report;
- Crane and/or equipment usage;
- Load and/or unload;
- Driver summary reports;
- Vehicle service reminders;
- Raw fleet data from the GPS device.
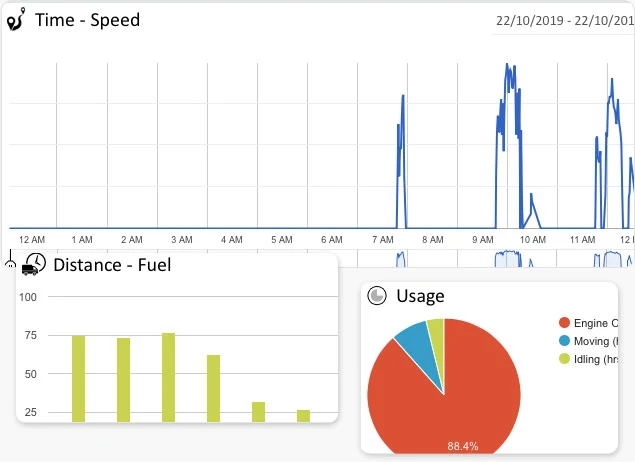
Charts
AVLView lets you view data in the form of informative charts and or spatially that help you better understand and analyse data.
- Charts based on vehicle usage;
- Based on time;
- Distance covered with a spatial view;
- Fuel level charts;
- Reefer temperature charts;
- Fleet load with the haul.
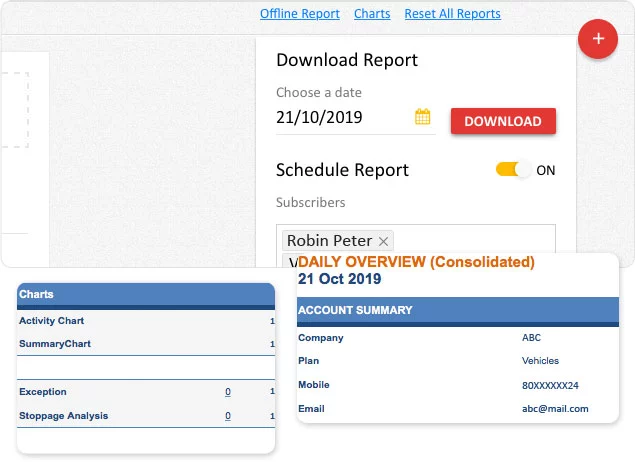
Offline report
In addition, you can configure to receive reports as and when you need.
- Scheduled offline report to be delivered via email;
- Add users who wish to subscribe and receive the report;
We did extensive research, evaluated many vehicle tracking systems before choosing AVLView. Thanks to their well-structured team giving us personal attention along the way.
Saudi Arabia
We did extensive research, evaluated many vehicle tracking systems before choosing AVLView. Thanks to their well-structured team giving us personal attention along the way.
Frequently Asked Questions
Vehicle tracking reports provide detailed information about the vehicles being tracked.
Real-time information from tracking reports allows you to analyze the vehicle activities and determine what steps need to be taken in order to improve your fleet management operations.
Therefore, reports can serve as a guide for managing your fleet and lowering costs.
Reports available in the platform depend on which type of events or criteria you are interested in seeing.
Among the many reports currently available are vehicle activities, utilisation, driver behaviour—specifically incidents or accidents. There is also a report for monitoring fuel usage and temperature levels. Additionally there exists a current status report that describes vehicle condition at any point in time and trip-related data such as distances covered.
You can also create reports tailored to your specific needs.
Yes, absolutely. Ad hoc reports are a powerful feature of the platform. You can build them however you like by specifying any columns or fields and adding filters that meet your requirements—then run them whenever/as often as needed.
The Driver RAG report (acronym: Red, Amber, Green) is by far the best way to get a clear picture of what’s going on when your driver is behind the wheel: sudden braking, overspeeding—all are flagged.
If your reefer truck is equipped with temperature sensors, the platform will generate reports based on the data collected from those sensors.
The report provides information on the temperature at specific periods of time as well as vehicle location. You may view the temperature of multiple sensors at a time in the report.
Verifying actual fuel consumption has never been easier with AVLView’s new fuel reports. It’s ad-hoc report module generates real-time reports on fuel mileage, fuel consumption and can create charts for easy analysis.
To view vehicle activities outside of business hours, use the predefined report ‘Vehicle Summary (after Business hrs)’.
You may edit the report by setting the outside office hours (Time) from conditions and filters.
You can modify the report template so that you set non-office hours from conditions and filters. And the report will be generated based on vehicle activity for the specified period.
The vehicle utilisation report is the best way to keep tabs on your fleet’s overall use. The report provides detailed information such as total moving hours, mileage and idling time for each vehicle—among other things!
In addition, the report is presented in an easy-to-analyse chart format, so that you can gain greater insight into how vehicles are being utilised.
The daily summary report will give you a daily run-down of all the activity related to your vehicles.
In addition to the details of each trip, such as its start time, end time and distance traveled, you will also be able to see statistics including total active hours per day and average daily fuel consumption.
Yes, you can. You set up a schedule to receive timely reports via email—for example, once a week or once every month (or even daily).
You may receive reports in either PDF or Excel format.
You may choose to ‘Subscribe’ a report, and set the frequency as Daily. Then you’ll be able to select your boss’s name from the “Notify users(s)” dropdown list, reports can be sent in PDF or Excel format.
To temporarily stop receiving vehicle summary reports in your inbox, you can turn off the toggle button under “Subscribe” on that report. To remove yourself permanently from our notification list, click unsubscribe in any of our emails.

