Ask your fleet a question.
Get an answer, not a spreadsheet.
Which vehicles cost the most per kilometre? Which drivers are trending worse? AVLView surfaces the answers automatically — and shows the working behind every number.
Trusted by 43,000+ fleet owners worldwide






What this changes
Three things analytics should do that reporting doesn't
A report answers the question you already had. Analytics decides which question matters.
Cost Intelligence Per Asset
“I know what the fleet costs in total, but not which vehicles are draining it”
- ✓Cost per kilometre per vehicle, not per fleet
- ✓Fuel, maintenance, driver cost and age combined
- ✓Fleet P&L summary by asset
- ✓Maintenance cost weighted against vehicle age
Scores That Rank, Not Just Report
“I have plenty of numbers but no idea which problem to tackle first”
- ✓Asset performance scorecards
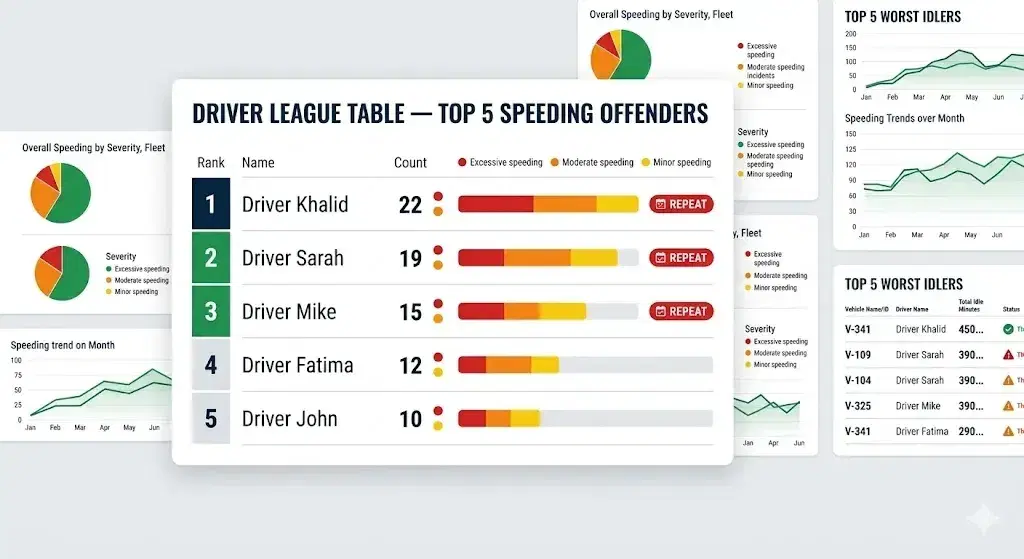
- ✓Driver safety performance scoring
- ✓Fleet ROI and utilisation ranking
- ✓Drill from any score to the trip behind it
Anomalies Found For You
“The expensive problems are the ones nobody thought to look for”
- ✓Fuel anomaly and theft detection
- ✓Trips that do not match their route
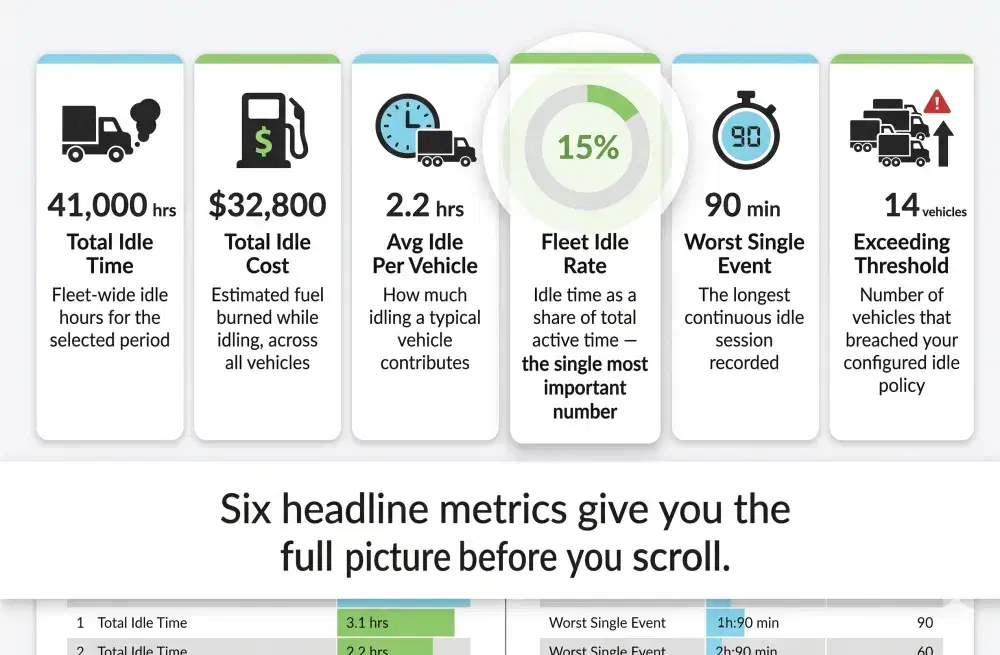
- ✓Unplanned stoppages and excessive idling
- ✓Geofence breaches and security events
How it works
From device to decision
No data team, no warehouse project, no overnight batch.

01
Connect the fleet
Any AIS-140 or supported GPS device — 200+ models — streams position, ignition, fuel and sensor data. Device-agnostic, so there is no hardware lock-in.
02
AVLView computes continuously
Cost, utilisation, safety and exception metrics recalculate as data arrives rather than in an overnight batch, so today's numbers are today's.
03
Read the ranked view
Open to a sorted list of what changed and what it cost, then drill from any score down to the individual trip or event behind it.
04
Act, schedule or automate
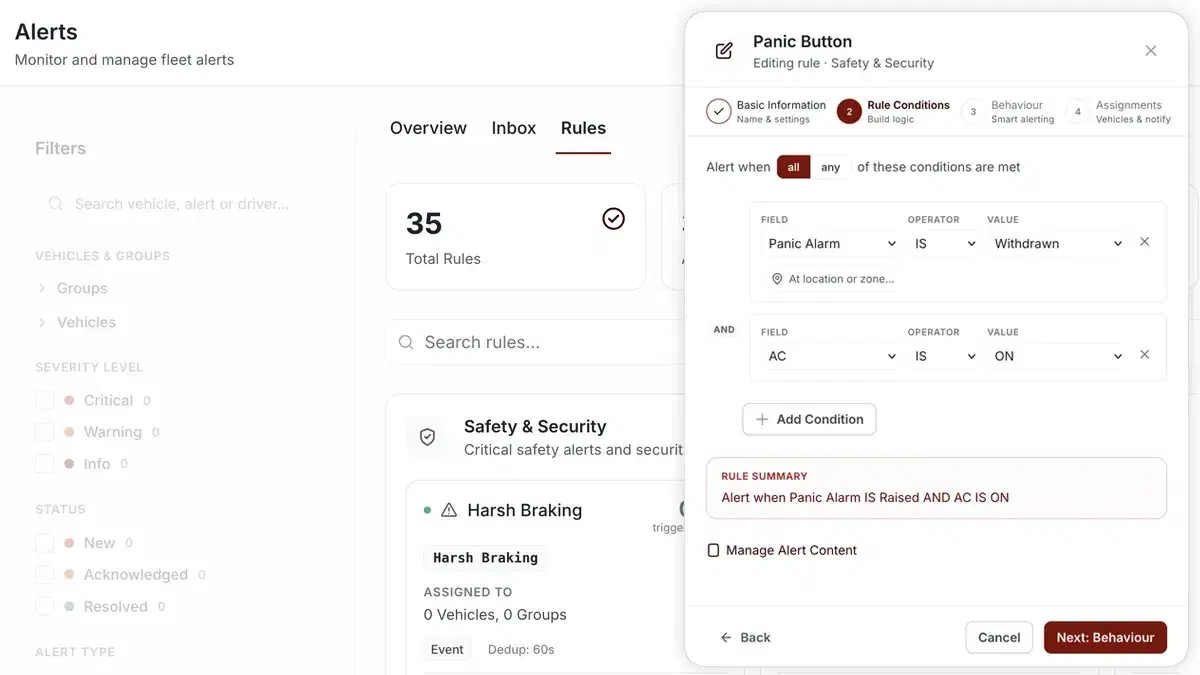
Send the report on your own cadence, or wire the exception to an alert so the next occurrence interrupts you instead of waiting to be found.
Report library
27 reports, already built
Every report below ships with AVLView — no report builder project, no consultant.
Each report exports to Excel and PDF, and can be scheduled to arrive by email.
FAQ
Fleet analytics questions
Fleet analytics software turns raw GPS and telematics data into comparable metrics — cost per kilometre, utilisation rate, safety scores, exception counts — so a fleet manager can rank vehicles and drivers instead of reading raw logs. AVLView computes these continuously from any supported GPS device.
Get started
See your own fleet's numbers
We'll load a sample of your data and walk you through the cost, utilisation and safety views in about 15 minutes.