Fleet Cost Per Kilometre
The Fleet Cost Per Kilometre report answers a simple but powerful question: what does it actually cost you to move one kilometre? It is built for fleet owners and finance teams who want to compare vehicles on a level playing field and make confident right-sizing decisions.
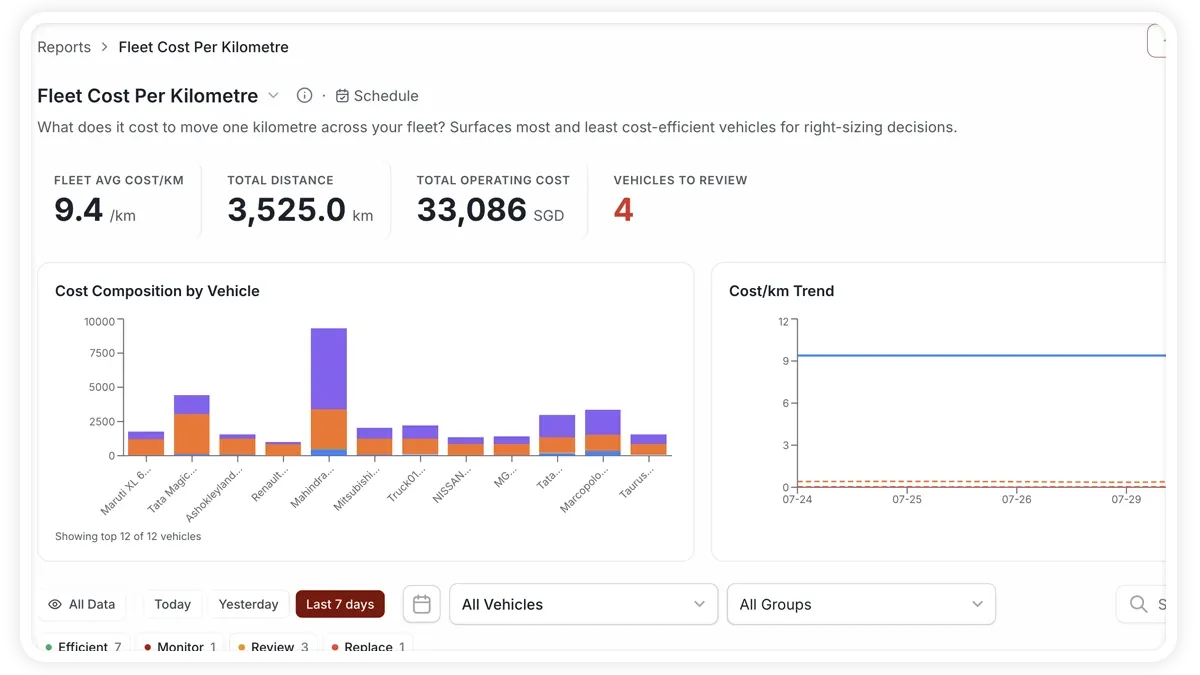
What the report shows
Every operating cost is divided by the distance travelled, so you can benchmark vehicles that do very different mileage against each other.
- Fleet Avg Cost/km — the blended cost to move one kilometre across the whole fleet, your headline efficiency number.
- Total Operating Cost — the full cost base for the period, covering fuel, maintenance and other running costs.
- Total Distance — the combined kilometres driven by the fleet, the denominator behind the cost/km figure.
- Best Vehicle — the most cost-efficient vehicle, with the lowest cost per kilometre.
- Worst Vehicle — the least cost-efficient vehicle, the first candidate for review or replacement.
- Month-on-Month — how this period’s cost per kilometre compares with the previous one, so you can see the trend.
How to run it
- Open Reports and choose the Fuel & Cost category (or search “cost per km”).
- Select Fleet Cost Per Kilometre.
- Set the date range you want.
- Click View to see it on screen, or Download for a PDF or Excel copy.
Schedule it
Open the Scheduled tab to have this report emailed to you automatically each month, so cost-per-kilometre trends land in your inbox without anyone running the report by hand.
Frequently asked questions
Why compare vehicles on cost per kilometre instead of total cost?
Total cost punishes the vehicles that do the most work. Cost per kilometre normalises for distance, so a van that covers 4,000 km and a car that covers 1,000 km can be judged on the same efficiency basis.
What makes a vehicle show up as the worst?
A high cost per kilometre usually points to heavy fuel use, rising maintenance, or low utilisation. The worst vehicle is your best starting point for a right-sizing or replacement review.
Related reports
Learn more about this feature
Explore feature