Join 43,000+ fleet owners tracking smarter.

Start Freeor book a live demo
AVLView

GPS fleet tracking trusted by 43,000+ fleet owners worldwide. Automate operations, cut costs, and scale effortlessly.

GDPR Compliant
Singapore • 11 Countries Worldwide
Philippines•India
support@avlview.com
+65 8228 4559

Fleet tips, straight to your inbox

No spam, unsubscribe anytime.

support@avlview.com+65 8228 4559
Product
  • Fleet Tracking
  • Driver Safety
  • Fuel Monitoring
  • Maintenance
  • Geofencing
  • Landmarks & POIs
  • Reports & Alerts
  • Fleet Capacity
  • API Integration
Solutions
  • Partner Program50-75% margins
Resources
  • Blog
  • Help Center
  • API Reference
Company
  • About Us
  • Become a Partner
  • Contact
  • Pricing
Locations
  • Dubai
  • Riyadh
  • Singapore
  • India
  • Philippines
  • USA

© 2026 AVLView. All rights reserved.

Privacy PolicyTerms of ServiceEULACookie Policy

We use cookies to improve your experience and analyse site traffic. Cookie Policy

AVLView
Pricing
🇸🇬+65 8228 4559
العربيةLogin
Getting Started
Alerts & Reminders
Maps & Geofencing
Supported Devices
Reports
  • Reports Overview
  • Vehicle Timeline
  • Fleet Activity
  • Trip - Ignition/Stoppage
  • Live Fleet Status
  • First Movement
  • Unplanned Stoppage
  • End of Day Fleet Summary
  • Speeding
  • Driver Safety & Performance
  • Driver Hours & Shift Compliance
  • Driver Cost & Liability
  • Fleet Cost Per Kilometre
  • Idle Time Ranking
  • Fuel Anomaly & Theft Detection
  • POI Visit
  • Geofence Breach
  • Compliance & Liability Exposure
  • Fleet ROI & Utilisation Score
  • Maintenance Cost vs Vehicle Age
  • Asset Performance Scorecard
  • Temperature Overview
  • Temperature Exceptions
  • Cold Chain Certificate
  • Crane Usage
  • Equipment Usage
  • Security Events
  • Fleet P&L Summary
Analytics
Service & Maintenance
Trip Scheduling
Dashboard
Settings & Admin
Troubleshooting
What's New
Reports
Published Jul 2026

Driver Cost & Liability

On this page

  • What the report shows
  • How to run it
  • Schedule it
  • Frequently asked questions
  • Related reports

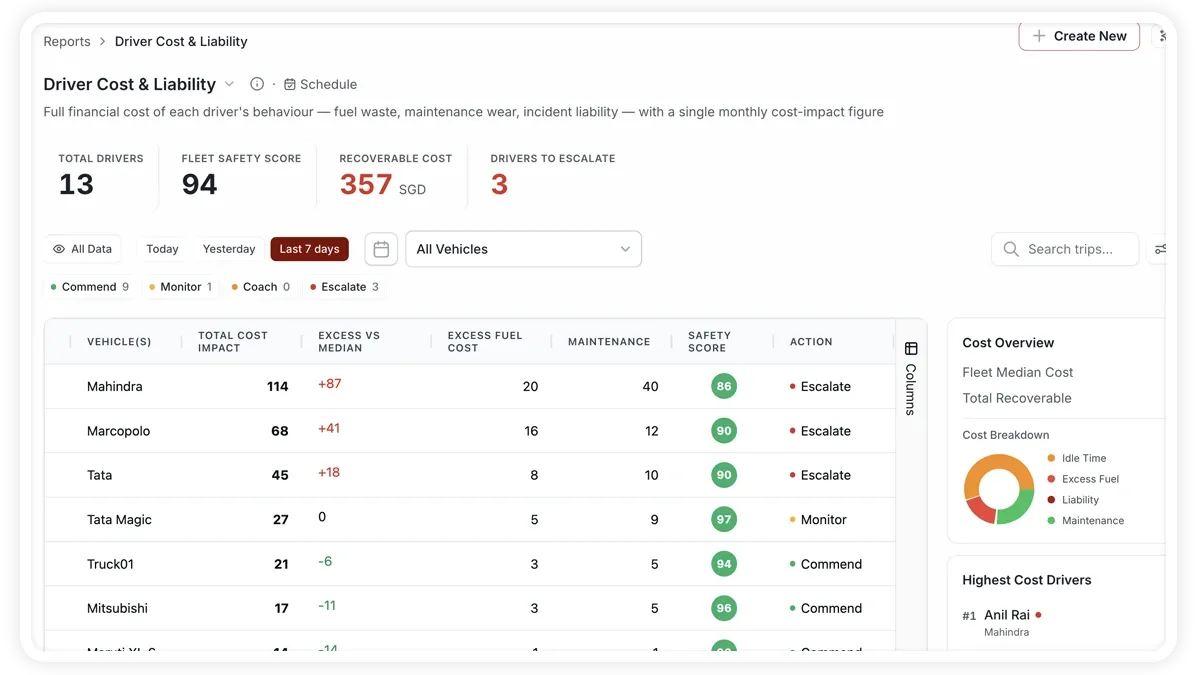
The Driver Cost & Liability report translates driver behaviour into money, combining fuel waste, maintenance wear and incident liability into a single monthly cost-impact figure per driver.
🖼️ IMAGE PLACEHOLDER — supplied by design

Dimensions: 1200 × 900 px (4:3) · PNG or WebP · under 200 KB

Shows: The Driver Cost & Liability report with the summary bar (Median Cost Impact, Total Excess Cost, Highest Cost Driver) above the per-driver cost table.

Alt text: AVLView Driver Cost and Liability report showing monthly cost impact per driver with fuel, maintenance and liability components.

What the report shows

Each row puts a cost against a driver, and the summary bar totals the financial impact across the fleet:

  • Median Cost Impact — the typical monthly cost of a driver's behaviour, a robust midpoint that ignores outliers.
  • Total Excess Cost — the fleet-wide sum of avoidable cost driven by behaviour.
  • Highest Cost Driver — the driver whose behaviour carries the biggest monthly cost, your first coaching priority.
  • Drivers Above Threshold — how many drivers exceed your acceptable cost level, sizing the problem.
  • Fleet Safety Score — the overall safety score tying behaviour back to risk and cost.

How to run it

  1. Open Reports and choose the Driver Safety category (or search “driver cost”).
  2. Select Driver Cost & Liability.
  3. Set the date range you want.
  4. Click View to see it on screen, or Download for a PDF or Excel copy.

Schedule it

Use the Scheduled tab to email the cost summary each month — a monthly cadence matches the report's cost-impact figure and keeps finance and operations aligned.

Frequently asked questions

What goes into the cost-impact figure?

It combines fuel waste, maintenance wear and incident liability into one monthly number, so behaviour is measured in the same currency as your budget.

Why use the median rather than the average?

The Median Cost Impact reflects the typical driver without being skewed by a few very high-cost outliers, giving a fairer sense of everyday behaviour.

Related reports

  • Driver Safety & Performance
  • Speeding
  • Driver Hours & Shift Compliance
Next
Fleet Cost Per Kilometre
Learn how AVLView’s Fleet Cost Per Kilometre report reveals your cost to move one km, ranks vehicles by efficiency, and guides right-sizing decisions.
Continue

Learn more about this feature

Explore feature

More in Reports

  • Reports Overview
  • Vehicle Timeline
  • Fleet Activity
  • Trip - Ignition/Stoppage
  • Live Fleet Status
Didn't find what you needed?Contact support

In this guide

  • What the report shows
  • How to run it
  • Schedule it
  • Frequently asked questions
  • Related reports
Need a hand?

Talk to our team in your language.

Contact support