Map Layers, Views & Traffic
The MapView map can be tailored to show exactly what you need — a clean roadmap or a satellite image, with vehicles, places, zones and traffic layered on top. Everything is controlled from the Layers panel on the right-hand toolbar.
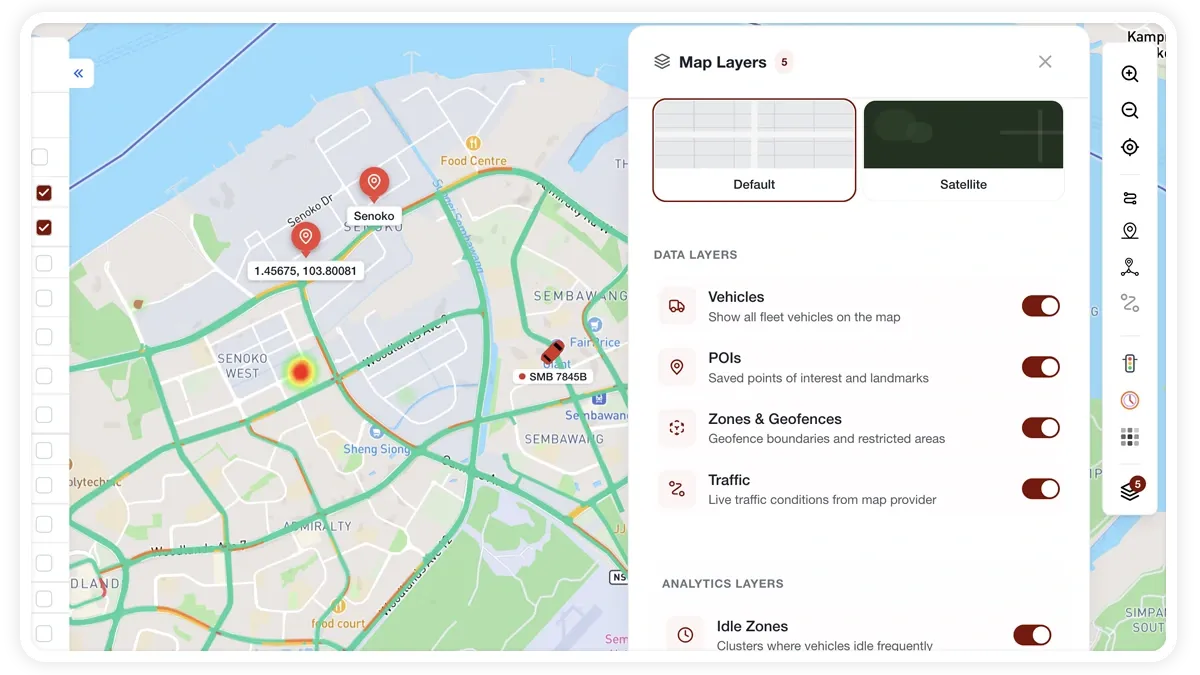
How to change map layers and views
- Click the Layers button on the right toolbar to open the Map Layers panel.
- Under Map Style, choose Roadmap for a standard street map or Satellite for aerial imagery.
- Under Data Layers, toggle Vehicles, POIs, Zones / Geofences and Traffic on or off. A badge shows how many data layers are currently active.
- Under Analytics Layers, turn on Idle Zones or the Activity Heatmap when you want to study fleet behaviour.
What each layer shows
- Vehicles — live vehicle markers. At low zoom they group into clusters that show counts of moving, idling and stopped vehicles.
- POIs — your saved points of interest, such as depots and client sites.
- Zones / Geofences — geofenced areas drawn on the map.
- Traffic — live road-traffic conditions.
- Idle Zones — a heatmap highlighting where vehicles spend time idling.
- Activity Heatmap — trip arcs showing where your fleet travels most. It can also be toggled directly from the right toolbar.
The toolbar also carries zoom in / out buttons and a current location button that centres the map on you (your browser will ask for location permission the first time).
Frequently asked questions
Can I set a default map style so I don't change it every time?
Yes. The default map provider and default style are set in Settings → General, so the map opens the way you prefer each session.
Why do my vehicles group into a single marker?
Marker clustering is automatic at low zoom levels to keep the map readable. Each cluster shows the number of moving, idling and stopped vehicles it contains — zoom in to break the cluster apart into individual vehicles.
Related
Learn more about this feature
Explore feature