Published Aug 2026
How the Fleet Health Score Works
The Health Score on the Services Dashboard sums up how well-maintained a vehicle — and your whole fleet — is, as a single number from 0 to 100.
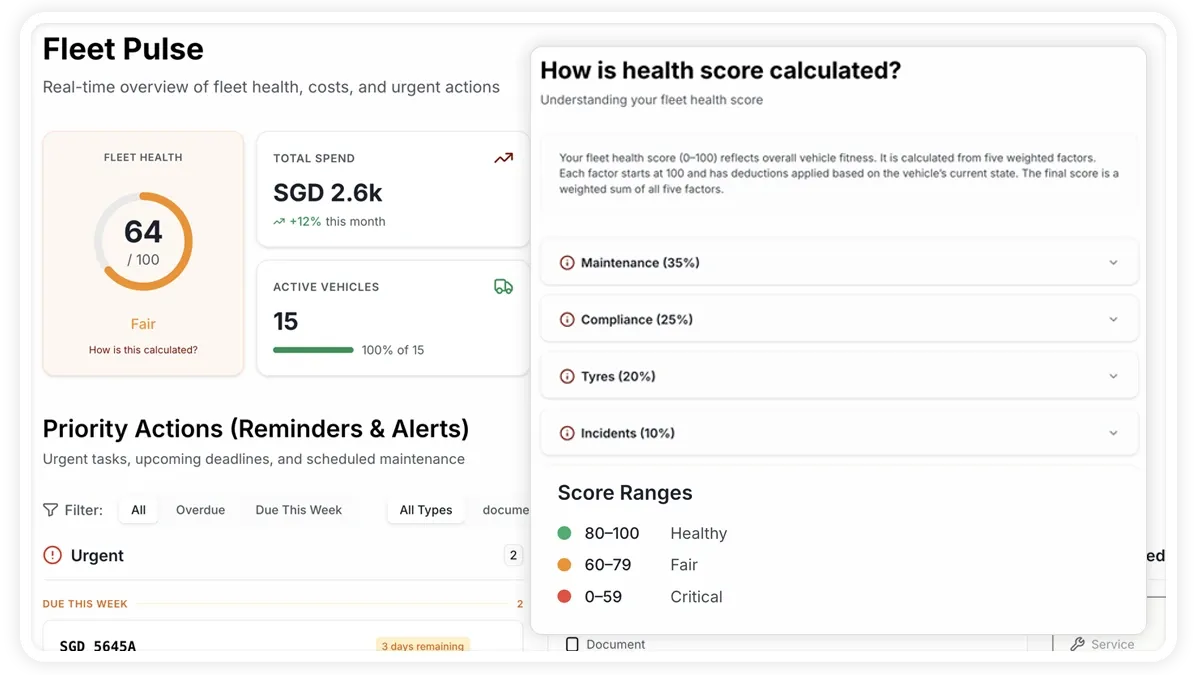
How the Health Score is calculated
The score combines five weighted factors:
- Maintenance — 35% — the largest factor; overdue or missing services lower it. Keep services logged and on schedule to improve it.
- Compliance — 25% — lapsed documents and inspections pull it down. Keep documents current and inspections passed.
- Tyres — 20% — worn or overdue tyres reduce it. Rotate and replace tyres on time to raise it.
- Incidents — 10% — recorded issues and incidents lower it. Fewer open issues means a higher score.
- Vehicle age — 10% — older vehicles score a little lower here; this reflects age rather than anything you can fix directly.
Score bands
- 80–100 Healthy — green; the vehicle is in good shape.
- 60–79 Fair — amber; some attention is needed.
- 0–59 Critical — red; act soon.
Frequently asked questions
Why does a vehicle show 'partial data'?
When records are missing — for example no fuel, expense, or document entries — the score shows partial data and prompts you to add records so it can be calculated fully.
Which factor moves the score most?
Maintenance, at 35%, carries the most weight, followed by Compliance at 25% and Tyres at 20%.
Related
Learn more about this feature
Explore featureMore in Service & Maintenance
Didn't find what you needed?Contact support