Fuel Consumption Control for Fleet Management
What You'll Learn
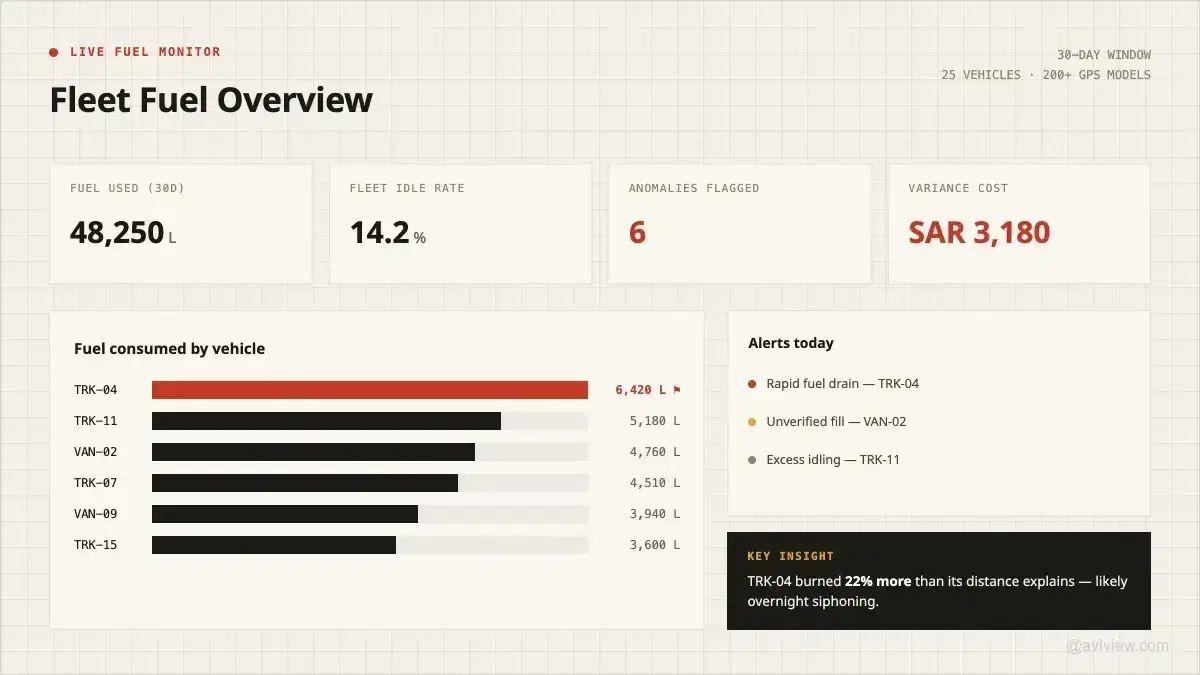
Fuel is your biggest controllable fleet cost. See the four levers — and the reports — that cut fuel spend 8–15%: idling, routes, driving and theft.
Best for:
Fuel Management professionals and fleet managers
Fuel is usually the largest line item a fleet manager can actually influence — and most fleets are overspending on it without knowing where the litres go.
The good news: the same GPS data you already collect for tracking can control fuel consumption. This guide shows the four levers that matter, how to set them up, and the realistic savings — 8–15% — that fleets across the Gulf, Africa and Asia see when they act on the data.
Why fuel is the #1 controllable fleet cost
For most fleets, fuel is 30–40% of total operating cost — larger than maintenance, larger than insurance, and unlike the price at the pump, much of it is within your control.
You can't change the diesel price in Riyadh or Lagos, but you can change how much of it is wasted through idling, inefficient routing, aggressive driving and outright theft. That waste is typically where the 8–15% saving hides.
The mistake fleets make is treating fuel as a fixed cost to be absorbed. Treated as a variable cost to be managed, it becomes one of the fastest ROI wins in the whole operation.
How does GPS and telematics data control fuel consumption?
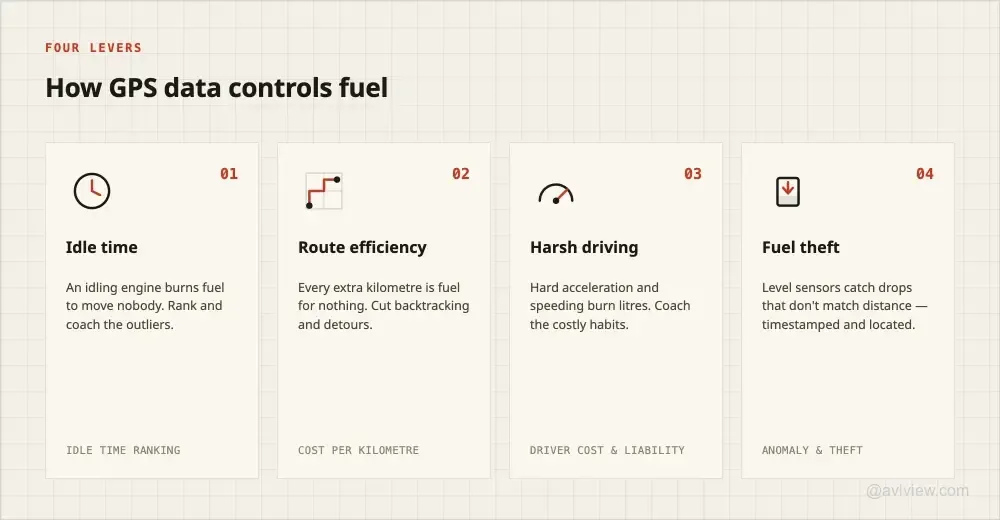
Fuel control comes down to four levers, all driven by data you can already capture.
1. Idle-time monitoring
An idling engine burns fuel to move nobody. Excess idling — waiting at loading bays, running the AC through a long break — can account for a large share of avoidable fuel spend in hot climates.
AVLView's Idle Time Ranking report ranks every vehicle by total idle time, attaches a currency cost to it, and shows the fleet idle rate, the single worst idle event and how many vehicles sit above your threshold — so you coach the outliers instead of the whole fleet. It's the fastest win of the four. (See our idle-time ranking report guide.)
2. Route efficiency
Every unnecessary kilometre is fuel spent for nothing. GPS route data exposes backtracking, off-route detours and poor sequencing, so dispatchers can tighten routes.
The Fleet Cost Per Kilometre report turns that into a number — what it costs to move one kilometre per vehicle — and names your most and least cost-efficient vehicles for right-sizing decisions. Fleets that optimise routing commonly cut both distance and delivery time.
3. Harsh-driving correlation
Rapid acceleration and speeding don't just raise accident risk — they raise fuel burn. Overlaying behaviour data on fuel data shows exactly which driving habits are costing litres.
The Driver Cost & Liability report goes a step further and puts a single monthly figure on each driver's fuel waste, maintenance wear and incident liability — making the coaching case concrete rather than abstract.
4. Fuel-level sensors and theft detection
Where fuel-level sensors are fitted, sudden drops that don't match distance travelled flag siphoning or pilferage — a real problem for fleets parked in unsecured yards overnight.
AVLView's Fuel Anomaly & Theft Detection report reconciles expected against actual consumption for every vehicle and classifies each anomaly with its estimated cost. Pairing sensor data with location turns a suspicion into a timestamped, located event — down to whether a fill-up happened at a known fuel station or somewhere it shouldn't have.
Inside a fuel anomaly report
The single most useful report for controlling fuel is one that answers a simple question: did this vehicle burn more fuel than the distance it drove can explain?
AVLView's Fuel Anomaly & Theft Detection report does exactly that. It calculates an expected consumption for each vehicle (distance driven × that vehicle's efficiency baseline), compares it to the actual litres consumed, and flags any vehicle whose variance exceeds a set threshold — 5% by default.
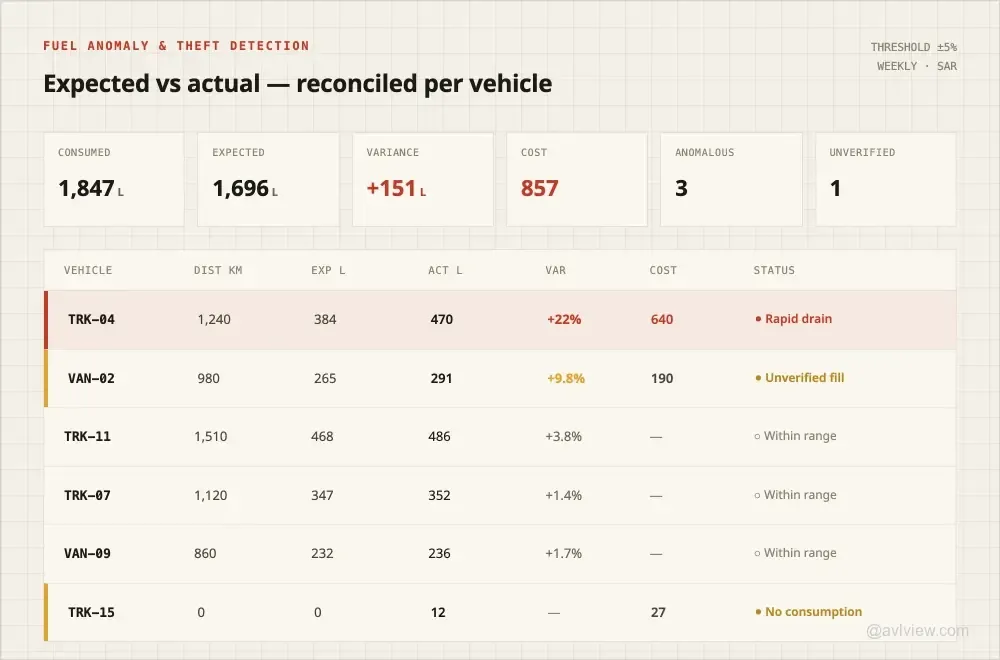
Every flag is classified so you know what you're looking at:
- Rapid drain — fuel level dropped sharply without matching distance. Possible siphoning or a leak.
- Unverified fill — a fill-up happened outside a known fuel station. Receipt reconciliation needed.
- High consumption — actual burn significantly exceeds the expected rate for the distance driven.
- No consumption — fuel was consumed but the vehicle recorded zero or negligible distance. Investigate.
The report headlines the numbers that matter to a fleet owner: total consumed vs expected, the unexplained variance in litres, the variance cost in your currency, how many vehicles are anomalous, and how many fill events were unverified.
Expand any vehicle and you get the fill-event trail — date, time, quantity added, location, tank level before and after, estimated cost, and a simple verified-or-not tick against a known fuel station. That turns "I think we're losing fuel" into an itemised, located, costed list you can act on.
See how AVLView monitors fuel and flags theft
The fuel-related reports at a glance
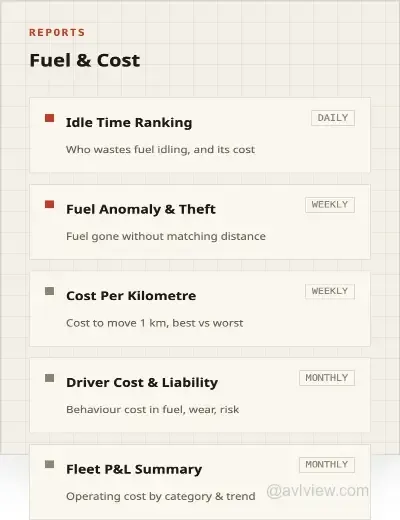
Fuel control isn't one screen — it's a small set of reports that each attack the spend from a different angle.
| Report | What it answers | Cadence |
|---|---|---|
| Idle Time Ranking | Which vehicles/drivers waste the most fuel idling, and what it costs | Daily |
| Fuel Anomaly & Theft Detection | Where is fuel disappearing without a matching distance? | Weekly |
| Fleet Cost Per Kilometre | What does it cost to move 1 km per vehicle — best vs worst? | Weekly |
| Driver Cost & Liability | What is each driver's behaviour costing in fuel, wear and liability? | Monthly |
| Fleet P&L Summary | Total operating cost by category (incl. the fuel line) and month-on-month trend | Monthly |
Behind those reports, the per-trip fuel view also records litres used, fuel cost, efficiency in km/L and the tank level at the start and end of every trip — and a Fuel Efficiency Analysis watchlist tracks each flagged vehicle's km/L against its target over 30 days, marking any suspected theft event on the trend line.
Basic tracking vs. fuel-focused telematics
| Capability | Basic GPS tracker | Fuel-focused telematics |
|---|---|---|
| Vehicle location | ✓ | ✓ |
| Idle-time ranking with cost | ✕ | ✓ |
| Cost-per-kilometre analysis | Partial | ✓ |
| Harsh-driving / fuel correlation | ✕ | ✓ |
| Fuel-level sensor + theft alerts | ✕ | ✓ |
| Expected-vs-actual fuel reconciliation | ✕ | ✓ |
| Unverified-fill / theft detection | ✕ | ✓ |
| Fuel-cost reporting per vehicle & driver | ✕ | ✓ |
Setting up fuel alerts and thresholds
Data only saves fuel when it triggers action. In AVLView you configure:
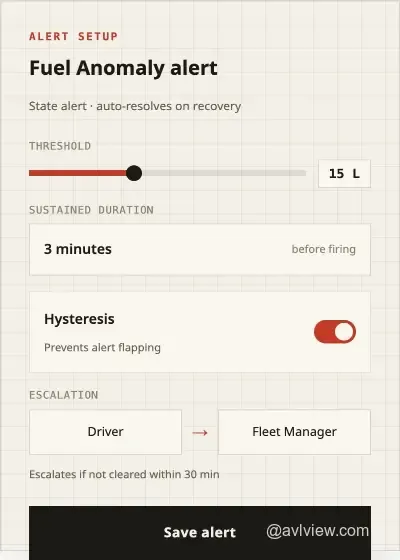
- Fuel Anomaly alert — a state alert that fires when the tank level drops below a threshold (e.g. 15 L) or falls inconsistently with distance driven. It auto-resolves when the level recovers, uses hysteresis so it doesn't flap, and escalates from driver to fleet manager if it isn't cleared.
- Excessive Idling alert — fires when a vehicle idles beyond a set duration with the ignition on (e.g. 15 minutes), tuned per use case so loading bays don't spam the dashboard.
- Fuel-station geofence alert — a "watch this zone" rule that fires on entry and dwell at a fuel station, so every fill-up is timestamped and located — the backbone of unverified-fill detection.
- Speeding alerts — against the posted limit per segment, since speeding is both a safety and a fuel issue.
- Scheduled fuel reports — push the Fuel Anomaly and Idle Time Ranking reports to inboxes daily or weekly, so trends surface before they become quarterly surprises.
Keep the alert set tight. If managers get flooded, they stop looking — the same alert-fatigue trap that undermines safety monitoring.
Note on hardware: fuel-drop and theft detection need a fuel-level sensor fitted and calibrated (AVLView stores a per-vehicle voltage-to-litres calibration table). Idle, route, cost-per-km and harsh-driving control work on the GPS device alone — no sensor required.
How much can you save?
Across AVLView's 43,000+ fleet owners, the consistent benchmark is an 8–15% reduction in fuel spend once idling, routing and driving behaviour are actively managed.
On a 25-vehicle fleet, that is often the difference between a fuel budget that creeps up every quarter and one that trends down — frequently paying for the tracking platform several times over within the first year.
The exact figure depends on your starting point: fleets with heavy idling or no routing discipline see the top of that range; already-tight operations see the lower end but still gain the theft-prevention and reporting benefits.
Getting started checklist
- Baseline it. Pull one month of current fuel spend and idle time so you can prove the saving later.
- Turn on idle and fuel-drop alerts. The two fastest wins.
- Rank drivers by idle time and harsh events. Coach the bottom 20%.
- Review routes weekly. Cut the backtracking the map reveals.
- Fit fuel-level sensors on high-risk vehicles for theft detection.
- Report monthly against your baseline and adjust thresholds.
For the strategic view of how tracking lowers fuel cost, see our pillar guide: how GPS fleet tracking reduces fuel costs. To understand the tracking-vs-telematics distinction behind these features, see GPS tracking vs telematics.
Control your fuel spend with AVLView
AVLView turns your GPS and fuel-sensor data into idle rankings, theft alerts and per-vehicle fuel reporting — device-agnostic, across 200+ GPS models.
See where your fleet's fuel is going, and stop paying for the litres you never used.
Related fuel guides
- Fuel theft prevention: how to stop fleet fuel loss
- Fuel level sensors: how fleet fuel monitoring works
- Fuel tracking system for trucks & diesel fleets
FAQ
How can GPS tracking reduce fuel consumption?
GPS and telematics data control fuel through four levers: cutting excess idling, tightening routes to remove unnecessary kilometres, coaching harsh driving that burns fuel, and detecting fuel theft via level sensors — together typically saving 8–15%.
How much fuel can a fleet realistically save?
Fleets that actively manage idling, routing and driving behaviour commonly cut fuel spend by 8–15%. Operations starting with heavy idling or no routing discipline see the top of that range.
What is fuel theft detection and how does it work?
Fuel-level sensors report tank volume; when the level drops in a way that doesn't match distance travelled, the system flags a likely siphoning event with its exact time and location, turning suspicion into evidence.
Which fuel reports does AVLView provide?
Five reports attack fuel spend from different angles: Idle Time Ranking (daily), Fuel Anomaly & Theft Detection (weekly), Fleet Cost Per Kilometre (weekly), Driver Cost & Liability (monthly) and Fleet P&L Summary (monthly). Each can be scheduled and pushed to inboxes automatically.
What counts as a fuel anomaly?
AVLView compares each vehicle's actual consumption to its expected consumption (distance × efficiency baseline) and flags variance beyond a threshold — 5% by default. Anomalies are classified as rapid drain, unverified fill, high consumption or no consumption, each with an estimated cost so you can prioritise the most expensive first.
Do I need new hardware to control fuel consumption?
Idle, route and harsh-driving control work on most existing GPS devices; AVLView supports 200+ models. Fuel-theft detection additionally requires a fuel-level sensor fitted and calibrated on the vehicle.
Ready to Transform Your Fleet Operations?
See how AVLView helps fleet managers like you cut costs, improve safety, and boost efficiency with real-time GPS tracking.
Related Articles
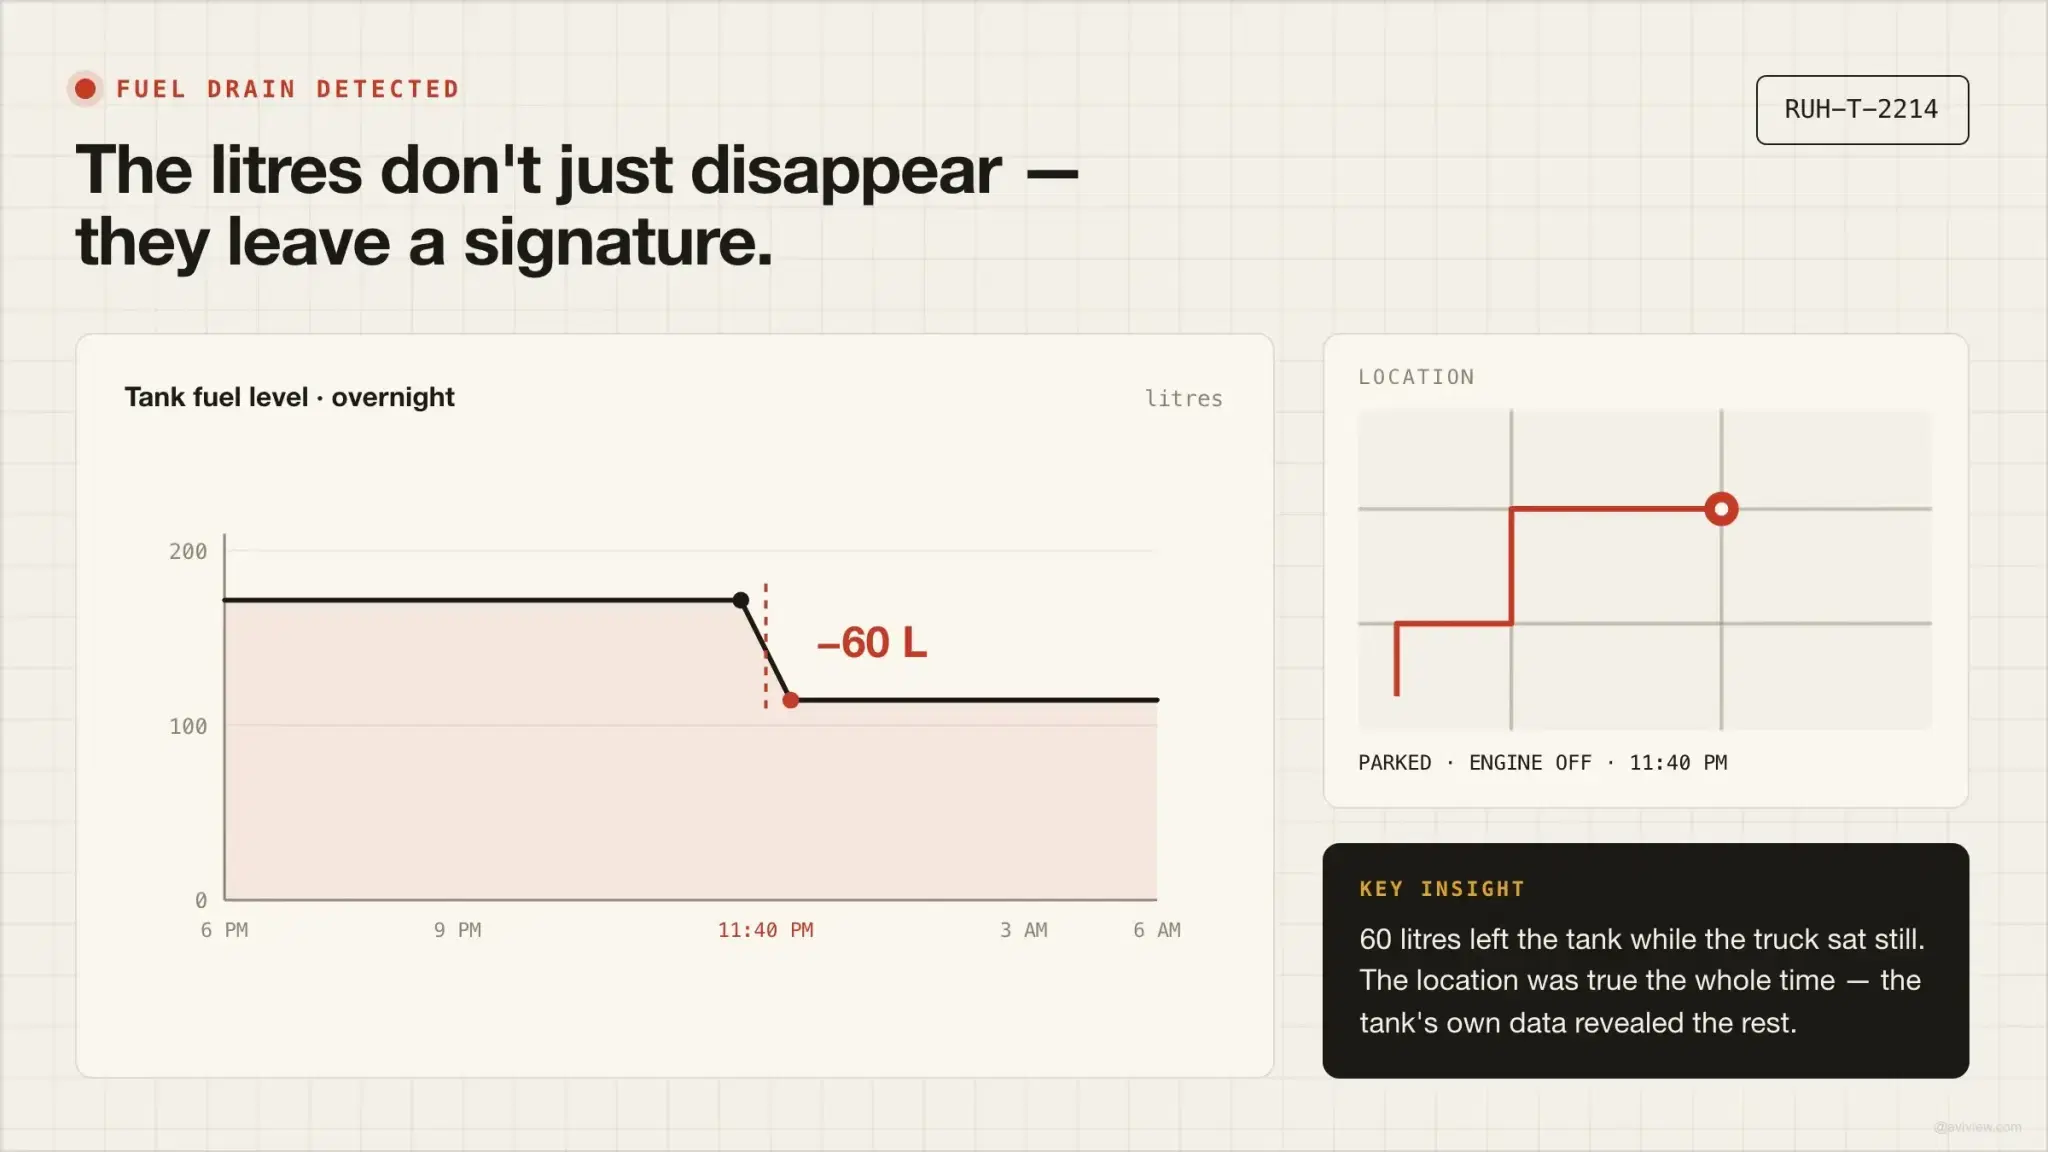
Fuel Theft Prevention: How to Stop Fleet Fuel Loss
Fuel theft can quietly drain a tenth of your fuel budget. Here's the sensor-plus-software system that catches siphoning, fake fills and tampering.
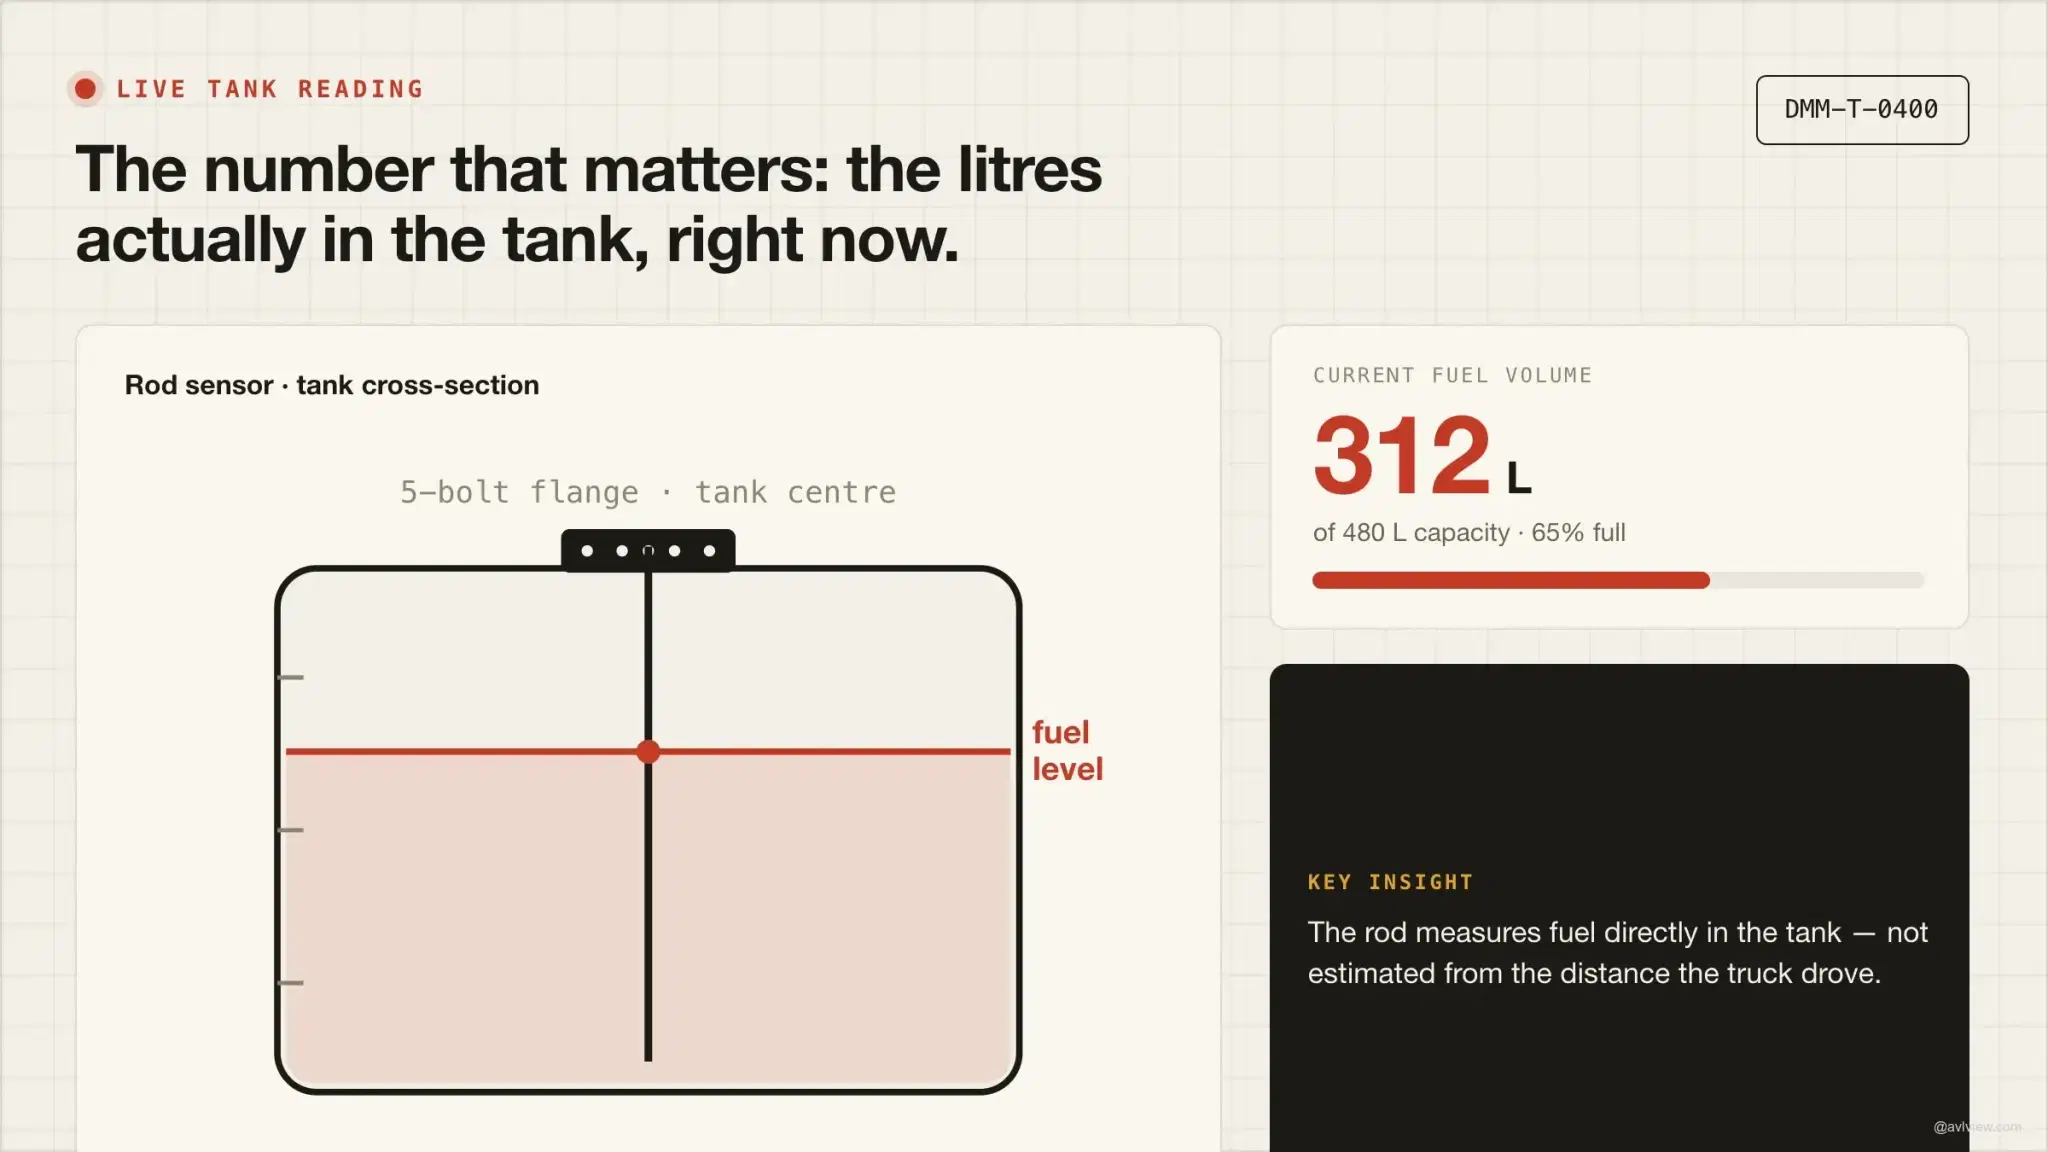
Fuel Level Sensors: How Fleet Fuel Monitoring Works
A fuel level sensor measures diesel directly in the tank — no guessing from distance. Here's how fleet fuel monitoring works, and how accurate it is.

Fuel Tracking System for Trucks & Diesel Fleets
Diesel truck fleets pay back fastest. Fleet fuel tracking measures litres per 100 km, compares near-identical trucks, and catches siphoning at rest.
Join 43,000+ Fleet Owners Who Trust AVLView
AVLView helps you:
- Cut fuel costs by 8-15% within 90 days
- Improve driver safety and reduce accidents by 40%
- Get real-time visibility into every vehicle 24/7
- Automate reporting and save 10+ hours per week
- 30-day pilot program with no long-term commitment