Idle Time Ranking Report: Find the Vehicles Burning Fuel for Nothing

What You'll Learn
Your fleet is burning fuel while standing still. The idle time ranking report shows exactly which vehicles waste the most and what it costs you.
Best for:
Logistics & Delivery professionals and fleet managers
Every fleet has vehicles that burn fuel while going nowhere. The problem is not whether it happens — it happens everywhere. The problem is knowing which vehicles, how much, and what it costs you.
The idle time ranking report answers all three questions in one view. It ranks every vehicle in your fleet from worst to best by idle time, translates wasted minutes into estimated fuel cost, and highlights repeat offenders so you can take targeted action.
Six Numbers That Tell You Everything
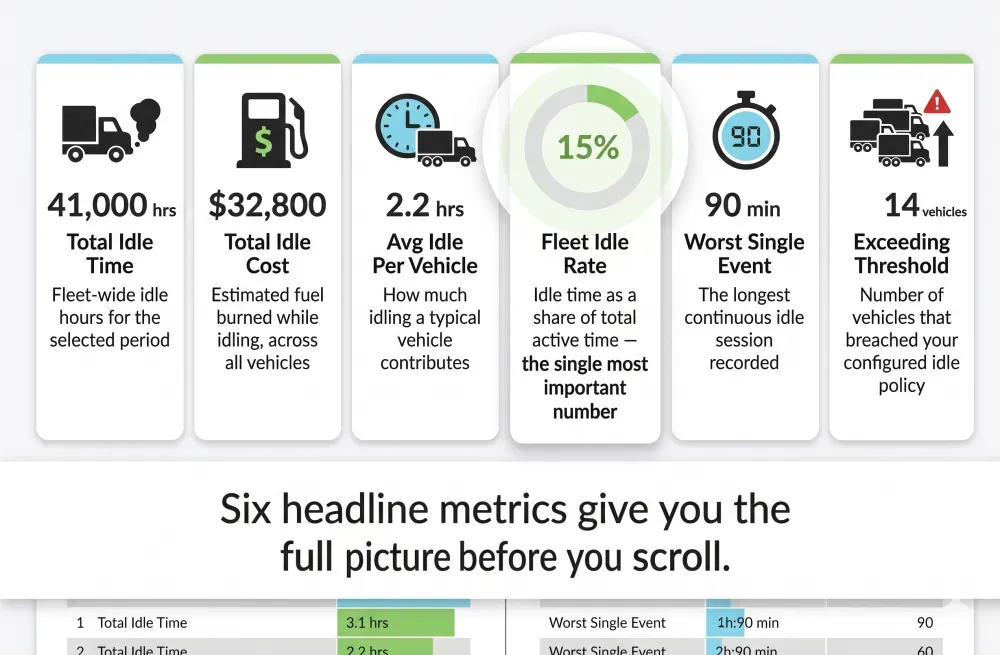
Before you look at a single vehicle, the KPI summary bar at the top gives you the fleet-wide picture.
| KPI | What It Tells You |
|---|---|
| Total Idle Time (hours) | Fleet-wide idle hours for the selected period |
| Total Idle Cost (currency) | Estimated fuel burned while idling, across all vehicles |
| Avg Idle Per Vehicle (hours) | How much idling a typical vehicle contributes |
| Fleet Idle Rate (%) | Idle time as a share of total active time — the single most important number |
| Worst Single Event (minutes) | The longest continuous idle session recorded |
| Exceeding Threshold (count) | Number of vehicles that breached your configured idle policy |
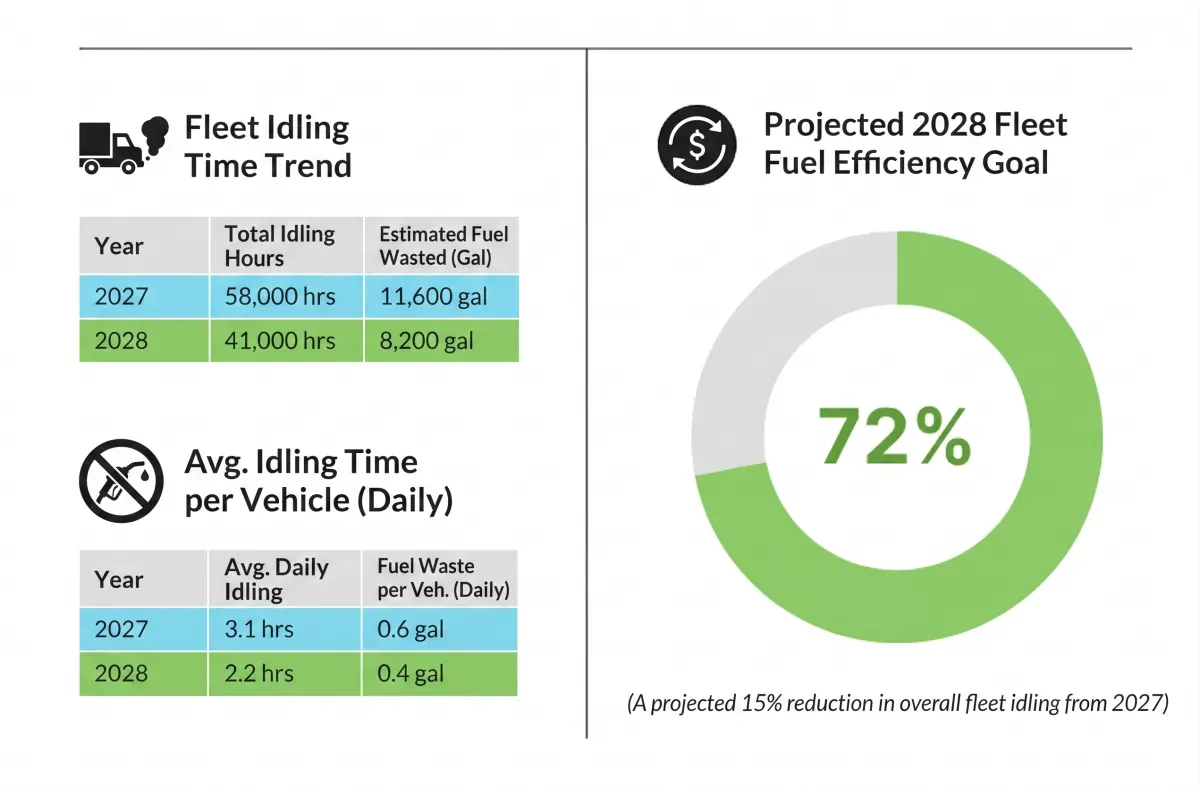
The fleet idle rate is the number to watch over time. Industry benchmarks sit below 15% for long-haul fleets and below 20% for urban delivery. If yours is above 30%, you are leaving serious money on the table.
The Ranking Grid — Worst to Best
The core of the report is a sortable, searchable table with one row per vehicle.
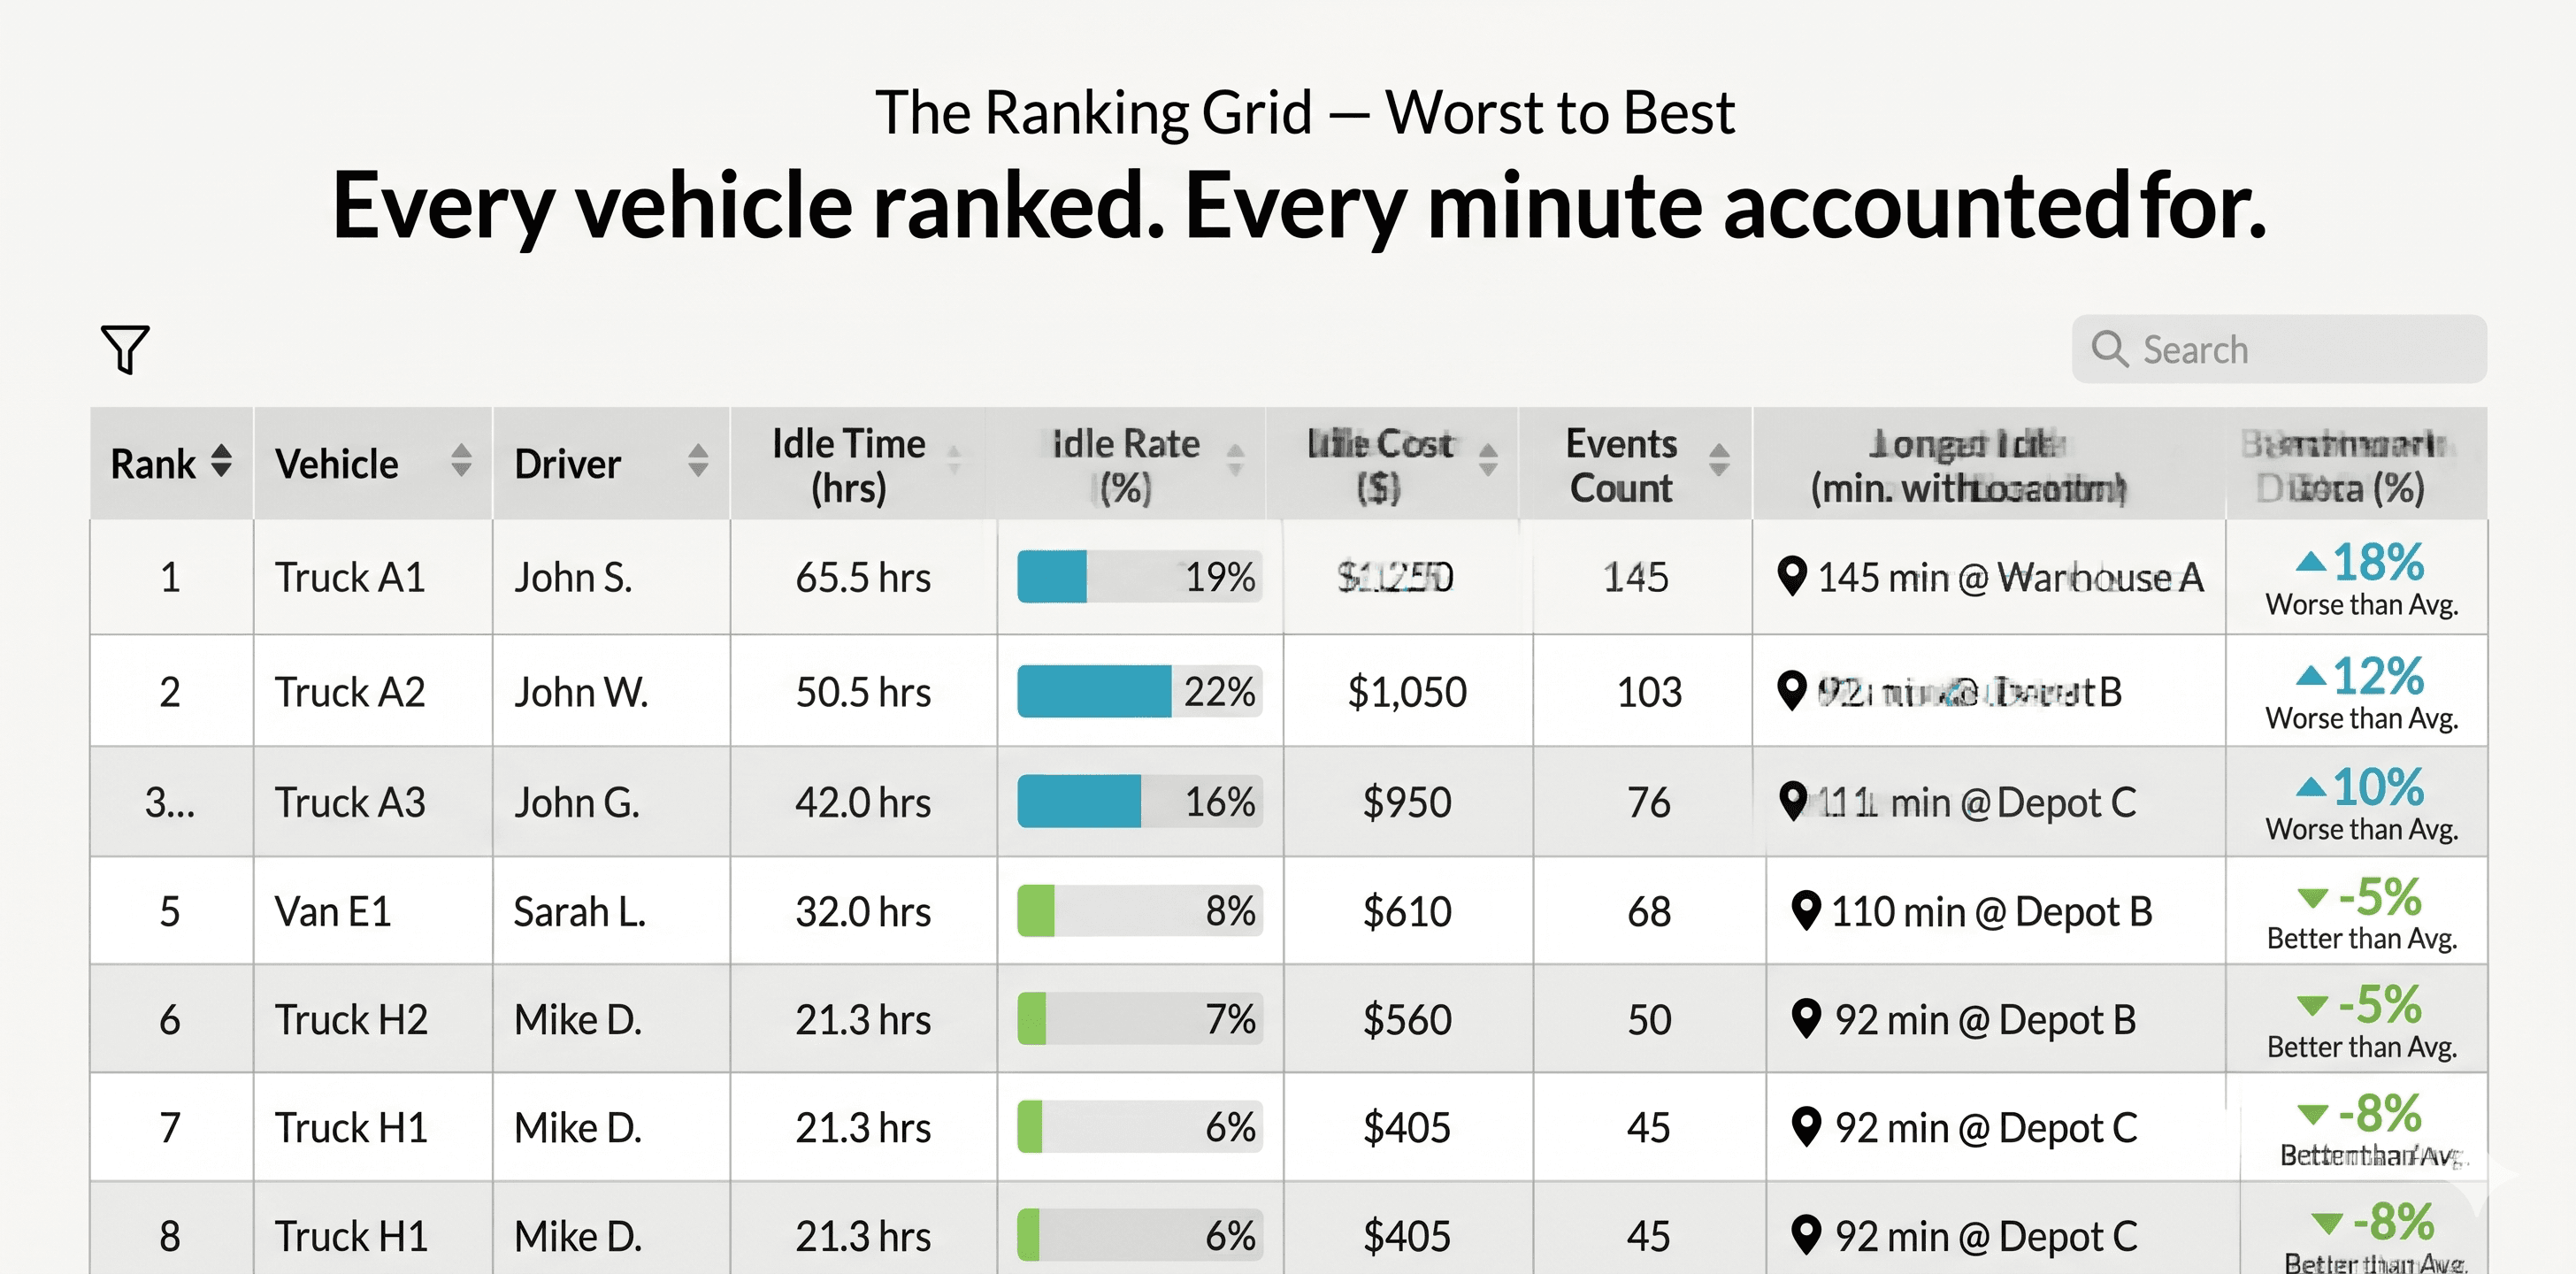
Each row shows the vehicle's rank, assigned driver, total idle time, idle rate, estimated cost, number of idle events, longest single event with its location, and how far above or below the fleet average it sits.
The benchmark delta column is particularly useful. A vehicle sitting at +18% versus the fleet average is significantly worse than peers operating in similar conditions. It removes the "but my route is harder" excuse and puts the focus on outliers.
Severity Bands
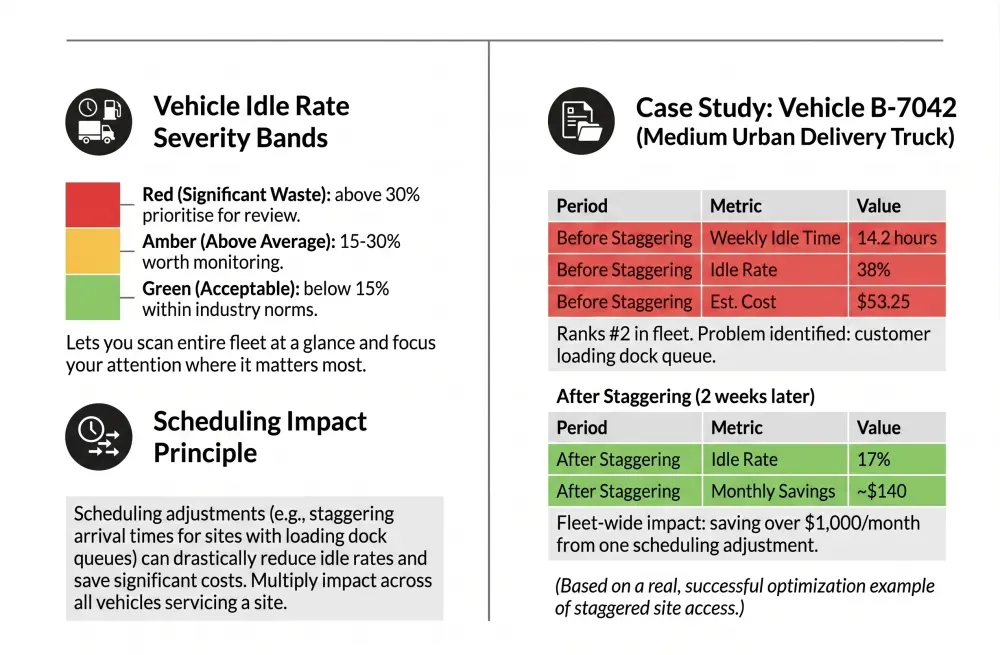
Vehicles are colour-coded into three bands based on idle rate:
- Green (below 15%): Acceptable — within industry norms.
- Amber (15–30%): Above average — worth monitoring.
- Red (above 30%): Significant fuel waste — prioritise for review.
This lets you scan the entire fleet at a glance and focus your attention where it matters most.
A Real Example
Take Vehicle B-7042, a medium delivery truck in a 60-vehicle urban fleet.
Weekly idle time: 14.2 hours. Idle rate: 38%. Estimated cost: $53.25.
That puts it firmly in the red band and ranks it #2 in the fleet.
Drilling into the events reveals a pattern. The three longest idle sessions — 45 minutes, 38 minutes, and 32 minutes — all happened at the same customer warehouse between 7:00 and 8:00 AM.
The driver was not the problem. The loading dock queue was.
The operations team staggered arrival times for that site. Within two weeks, Vehicle B-7042's idle rate dropped to 17% — saving roughly $140/month on that single truck.
Multiply that across the 8 vehicles that regularly service that site, and the fleet saved over $1,000/month from one scheduling adjustment.
See how AVLView helps you identify and fix fleet inefficiencies
Drill Down Into Individual Idle Events
Expanding any vehicle's row reveals every discrete idle event for the selected period.
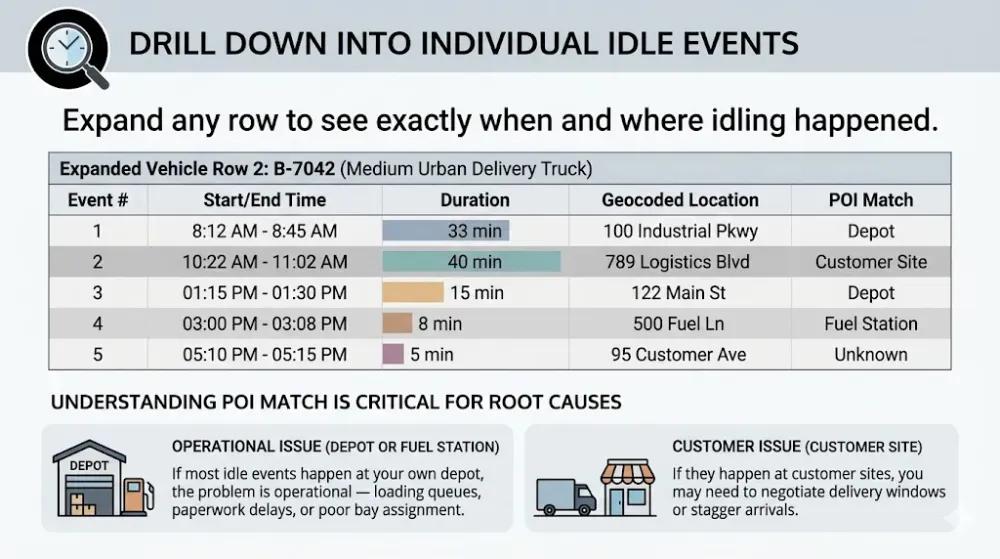
Each entry shows the vehicle name, assigned driver, total idle time, whether it breached your threshold, and a direct link to that vehicle's fleet activity report.
This sidebar is designed for the Monday morning review. Open the report, check the top 5, take action. No scrolling through hundreds of rows.
Top Idlers Sidebar
A focused panel on the side highlights the five worst offenders at a glance.
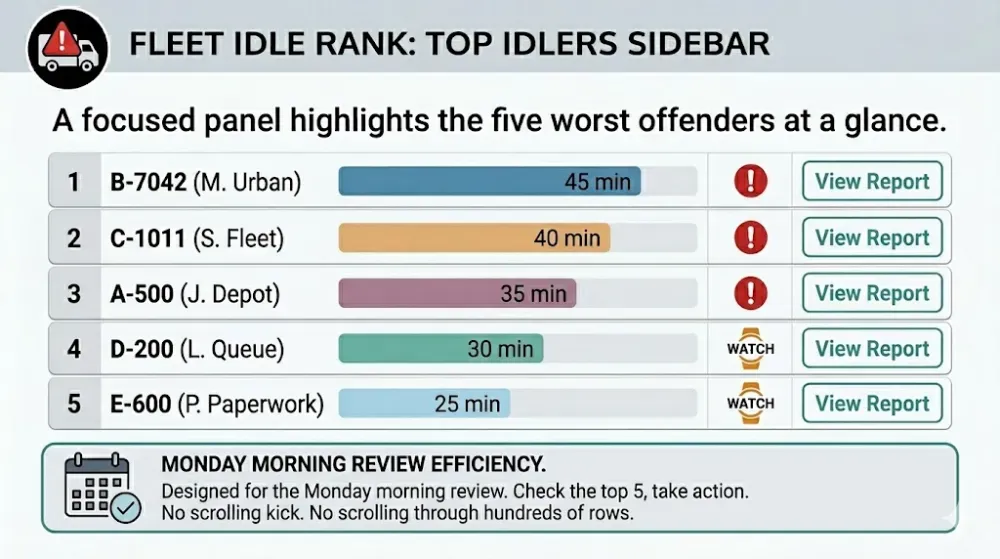
Each entry shows the vehicle name, assigned driver, total idle time, whether it breached your threshold, and a direct link to that vehicle’s fleet activity report.
This sidebar is designed for the Monday morning review. Open the report, check the top 5, take action. No scrolling through hundreds of rows.
What Counts as Idling
Not all idling is avoidable, and a good idle policy accounts for that.
| Type | Description | Avoidable? |
|---|---|---|
| Discretionary idle | Engine running during breaks, phone calls, paperwork | Yes |
| Warm-up idle | Engine running before departure | Mostly — modern engines need less than 30 seconds |
| Traffic/queue idle | Stuck in traffic or waiting at gates | Partially — route planning helps |
| PTO idle | Engine running to power equipment (cranes, pumps, refrigeration) | No — track separately |
| Regulatory idle | Required for DPF regen or emissions systems | No — exclude from policy |
Understanding these categories helps you set realistic thresholds. A refrigerated delivery fleet will naturally have higher idle numbers than a courier fleet. The report lets you filter and segment so you compare fairly.
How to Turn This Report Into Fuel Savings
Week One: Set the Baseline
Configure your idle threshold (5 minutes is a common starting point). Run the report for the past 30 days. Record your fleet idle rate and total idle cost. This is your baseline.
Week Two: Target the Top Three
Do not try to fix everyone at once. Focus on the three worst offenders. Review their drill-down data. Identify whether the root cause is driver behaviour, site-specific delays, or operational scheduling.
Week Three: Intervene
Share the rankings with drivers. Transparency creates accountability — the ranking format naturally drives competition. Coach the top offenders with specific data: "You idled for 45 minutes at the warehouse on Tuesday. Here is what that cost."
Ongoing: Track the Trend
Schedule a weekly export to fleet managers every Monday. Track your fleet idle rate month over month. A well-run fleet should see a 15–25% reduction in idle time within the first quarter of active monitoring.
One AVLView client — a logistics fleet of 120 vehicles in the Gulf region — reduced monthly idle costs by $3,200 within 8 weeks by following this exact approach. Their fleet idle rate dropped from 28% to 16%.
Start cutting your fleet's idle costs with AVLView
Filters and Views
The report is designed for flexibility:
- Date range — Today, yesterday, last 7 days, or custom range.
- Vehicle selector — Focus on a single vehicle or group.
- Idle rate band — Filter to only green, amber, or red vehicles.
- Quick search — Find by vehicle name, plate, or driver.
- Advanced columns — Toggle plate, group, active time, location, time-of-day, benchmark delta.
- Saved views — Save your preferred filter and column setup for one-click access.
- Export — Download as XLSX or XLS for offline analysis or sharing.
FAQ
How is idle time calculated?
Idle time is measured when the vehicle's engine is running but the GPS shows zero movement. The system uses a sustained duration threshold (configurable, typically 1–2 minutes) to filter out normal stops like traffic lights and short pauses.
How accurate is the idle cost estimate?
The cost estimate uses average fuel burn rates by vehicle type (0.8–1.5 L/hr for light vehicles, 1.5–3.0 L/hr for medium trucks, 3.0–5.0 L/hr for heavy trucks) multiplied by your configured fuel price. It is an estimate, not an exact measurement — but it is consistent enough to track trends and compare vehicles.
Can I exclude PTO idling from the report?
Yes. Vehicles with PTO equipment can be configured to exclude PTO-related idle events from the ranking. This ensures refrigerated trucks and crane vehicles are compared fairly against the rest of the fleet.
What is a good idle rate target?
Industry benchmarks suggest below 15% for long-haul fleets and below 20% for urban delivery fleets. Anything above 30% indicates significant waste. The right target depends on your fleet type, but tracking the trend matters more than hitting a specific number.
How often should I review this report?
Weekly reviews are the sweet spot for most fleets. A Monday morning check of the top 5 offenders takes less than 15 minutes and keeps idle time consistently visible. Monthly reviews are useful for tracking the overall fleet idle rate trend and measuring the impact of interventions.
Ready to Transform Your Fleet Operations?
See how AVLView helps fleet managers like you cut costs, improve safety, and boost efficiency with real-time GPS tracking.
Related Articles

How Drivers Block or Cheat GPS Trackers: 9 Tricks and How to Catch Every One
From foil wrapping to plug-in jammers, here are the 9 tricks drivers use to defeat vehicle trackers — and the alerts that catch every one.

GPS Tracking vs Telematics: What's the Difference — and Which Does Your Fleet Need?
GPS tracking answers where your vehicles are. Telematics answers how they're running, burning fuel and being driven. Here's how to choose.

Stop Staring at Maps — Let Trip Anomaly Detection Do the Work
Most GPS tracking tools show you where vehicles are, but not what
Join 43,000+ Fleet Owners Who Trust AVLView
AVLView helps you:
- Cut fuel costs by 8-15% within 90 days
- Improve driver safety and reduce accidents by 40%
- Get real-time visibility into every vehicle 24/7
- Automate reporting and save 10+ hours per week
- 30-day pilot program with no long-term commitment