Driver Behaviour Monitoring: The Complete Fleet Guide
What You'll Learn
How driver behaviour monitoring works, which metrics actually matter, and how fleets turn GPS data into safer driving and lower fuel costs.
Best for:
Logistics & Delivery professionals and fleet managers
Most fleet accidents don't come from bad luck — they come from repeat behaviours a manager never saw.
The driver who brakes hard at every junction. The one who idles through a two-hour lunch. The one who creeps 20 km/h over the limit on the highway to Jebel Ali.
Driver behaviour monitoring turns those invisible habits into numbers you can act on. This guide explains what it is, which metrics actually matter, and how to turn the data into safer, cheaper driving.
What is driver behaviour monitoring?
Driver behaviour monitoring is the continuous measurement of how a vehicle is being driven — harsh braking, rapid acceleration, speeding, cornering, and idling — using GPS and telematics data instead of guesswork.
Each event is time-stamped, located on a map, and rolled into a per-driver score. A fleet manager can compare a 40-vehicle fleet at a glance and coach the specific drivers pulling costs and risk up.
Unlike a basic GPS tracker that only answers "where is the vehicle?", behaviour monitoring answers "how is it being driven?" — the layer that actually predicts accidents, fuel waste, and wear.
Why driver behaviour monitoring matters
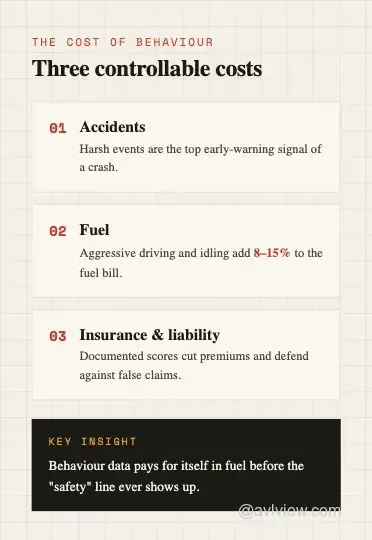
For fleets across the Middle East, Africa and Asia, three costs ride on driver behaviour — and all three are controllable.
Accidents. Harsh events are the leading early-warning signal of a crash. Fleets that coach against them typically see incident rates fall within the first quarter — before a single new policy is written.
Fuel. Aggressive acceleration, speeding and idling can add 8–15% to a fuel bill. On a 30-vehicle diesel fleet in Lagos or Riyadh, that is real money leaking every week.
Insurance and liability. Documented behaviour scores give you evidence for premium negotiations and protect you when a false claim lands after an incident.
The through-line: behaviour data pays for itself in fuel and accident reduction long before the "safety" benefit shows up in a spreadsheet.
What metrics should you track?
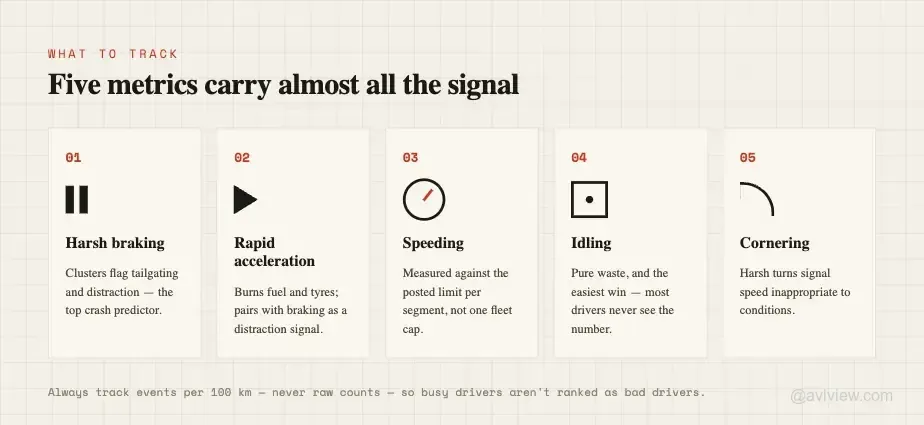
Not every data point deserves a manager's attention. These are the five that move safety and cost.
Harsh braking and rapid acceleration
The two highest-value signals. A cluster of harsh-braking events usually means tailgating or distraction; repeated hard acceleration burns fuel and tyres.
Track events per 100 km, not raw counts, so a long-haul driver isn't unfairly ranked against a city courier.
Speeding
Measure against the posted limit per road segment, not a single fleet-wide cap — 80 km/h is fine on a motorway and dangerous in a depot yard.
Persistent speeding is the single strongest predictor of a serious collision.
Idling
Excess idling is pure waste: fuel burned, engine hours added, emissions up, zero distance covered.
It is also the easiest win to coach, because most drivers don't realise how much they idle until they see the number.
Cornering and seatbelt / phone use
Harsh cornering signals speed inappropriate to conditions. Where hardware supports it, seatbelt and phone-use detection close the loop on the behaviours insurers care about most.
How does GPS-based driver monitoring work?
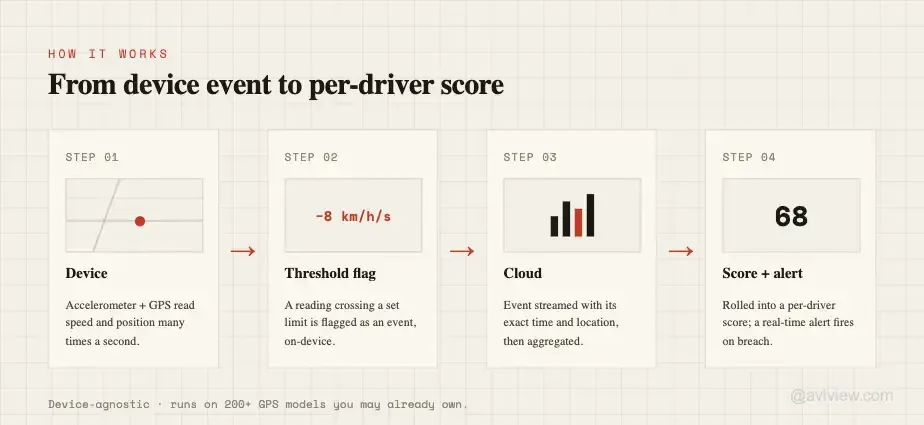
An AVLView-compatible device reads speed, position and accelerometer data many times a second. It flags any reading that crosses a configurable threshold — say, deceleration sharper than 8 km/h per second — and streams the event to the cloud with its exact location and time.
The platform aggregates events into a per-driver score and a fleet ranking, and can fire a real-time alert the moment a threshold is breached.
Because AVLView is device-agnostic and supports 200+ GPS models, you can run behaviour monitoring on the hardware you already own rather than re-fitting an entire fleet.
See it on your own fleet: AVLView driver safety coaching scores every driver from the GPS data you already collect — no new hardware required.
Basic tracking vs. behaviour monitoring
| Capability | Basic GPS tracker | Behaviour monitoring (telematics) |
|---|---|---|
| Vehicle location | ✓ | ✓ |
| Harsh braking / acceleration | ✕ | ✓ |
| Per-driver safety score | ✕ | ✓ |
| Speeding vs. posted limit | Partial | ✓ |
| Idle-time reporting | ✕ | ✓ |
| Real-time behaviour alerts | ✕ | ✓ |
| Coaching-ready reports | ✕ | ✓ |
If you are still deciding where tracking ends and telematics begins, our guide on GPS tracking vs telematics breaks down the difference in plain terms.
Turning data into driver coaching
Data alone changes nothing — coaching does. The fleets that get results follow a simple loop.
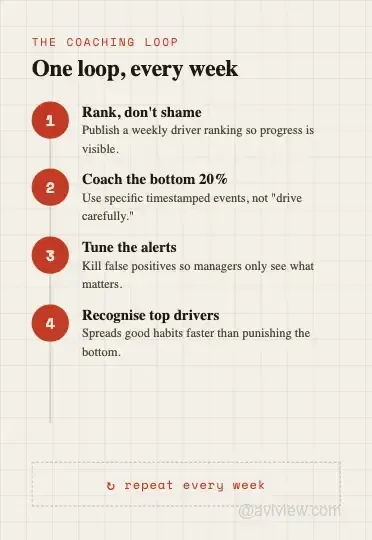
- Rank, don't shame. Publish a weekly driver ranking so improvement is visible and competitive. (See our guide on driver accountability and ranking.)
- Coach the outliers. Spend your time on the bottom 20%, using specific timestamped events — "three harsh-braking events on the Sheikh Zayed Road on Tuesday" beats "drive more carefully."
- Avoid alert fatigue. Tune thresholds so managers only see events that matter — here's how to fix fleet alert fatigue.
- Close the tamper gap. Some drivers try to defeat the system; know how drivers cheat GPS trackers so your data stays honest.
For a full scoring methodology, see our pillar guide: the complete guide to driver safety scoring.
A worked example
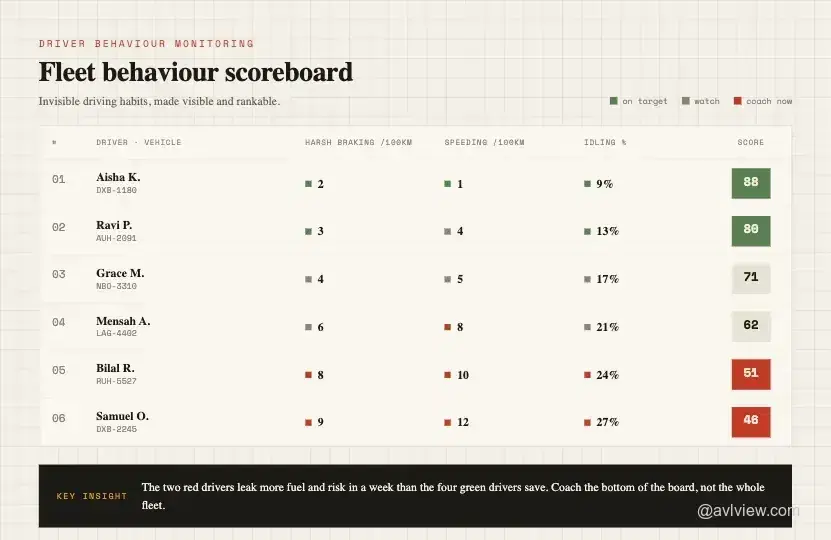
Take Vehicle DXB-2245, a delivery van in a 25-vehicle fleet. At baseline its driver, Samuel, ran 9 harsh-braking events per 100 km, an idle rate of 27%, and regular 15–20 km/h speeding on the motorway. Behaviour score: 46 (red).
The fleet manager coached from the data, not opinions — three specific braking events on one corridor, and the idle number in minutes. The target: harsh events under 4 per 100 km and idle below 18% in three weeks.
By week three, Samuel was at 3 harsh events per 100 km and a 16% idle rate, with a behaviour score of 68. The van's estimated idle-fuel waste fell from roughly $84 to $37 a month — one driver, one conversation, tracked against numbers he could see.
Common mistakes fleets make
Tracking everything, coaching nothing. A dashboard no one acts on is a cost, not a control.
One threshold for every road. Yard, city and motorway need different limits, or the data drowns in false positives.
Punishing raw counts. Always normalise per distance driven, or your busiest drivers look like your worst.
Ignoring the good drivers. Recognising the top performers spreads better habits faster than punishing the bottom.
Ready to score your fleet?
AVLView turns raw GPS data into per-driver safety scores, real-time alerts and coaching-ready reports — on the devices you already run.
Book a demo to see your own fleet's behaviour scored in minutes, on the hardware you already have.
FAQ
What is driver behaviour monitoring?
It is the continuous measurement of how a vehicle is driven — harsh braking, acceleration, speeding, cornering and idling — using GPS and telematics data, rolled into a per-driver score a fleet manager can act on.
Which driver behaviour metrics matter most?
Harsh braking and rapid acceleration are the highest-value signals, followed by speeding measured against the posted limit and excess idling. Track events per 100 km rather than raw counts.
Does driver behaviour monitoring reduce fuel costs?
Yes. Aggressive acceleration, speeding and idling can add 8–15% to a fuel bill, so coaching those behaviours directly lowers fuel spend as well as accident risk.
Do I need special hardware for behaviour monitoring?
Not necessarily. AVLView is device-agnostic and supports 200+ GPS models, so behaviour monitoring often runs on hardware a fleet already owns, provided the device reports accelerometer and speed data.
How does behaviour monitoring differ from GPS tracking?
A basic GPS tracker shows where a vehicle is; behaviour monitoring shows how it is being driven — the layer that predicts accidents, fuel waste and wear.
How quickly do fleets see results?
Fleets that coach against harsh events typically see incident rates and idle time fall within the first quarter of consistent weekly coaching.
Ready to Transform Your Fleet Operations?
See how AVLView helps fleet managers like you cut costs, improve safety, and boost efficiency with real-time GPS tracking.
Frequently Asked Questions
What is driver behaviour monitoring?
▼
Which driver behaviour metrics matter most?
▼
Does driver behaviour monitoring reduce fuel costs?
▼
Do I need special hardware for behaviour monitoring?
▼
How does behaviour monitoring differ from GPS tracking?
▼
How quickly do fleets see results?
▼
Related Articles
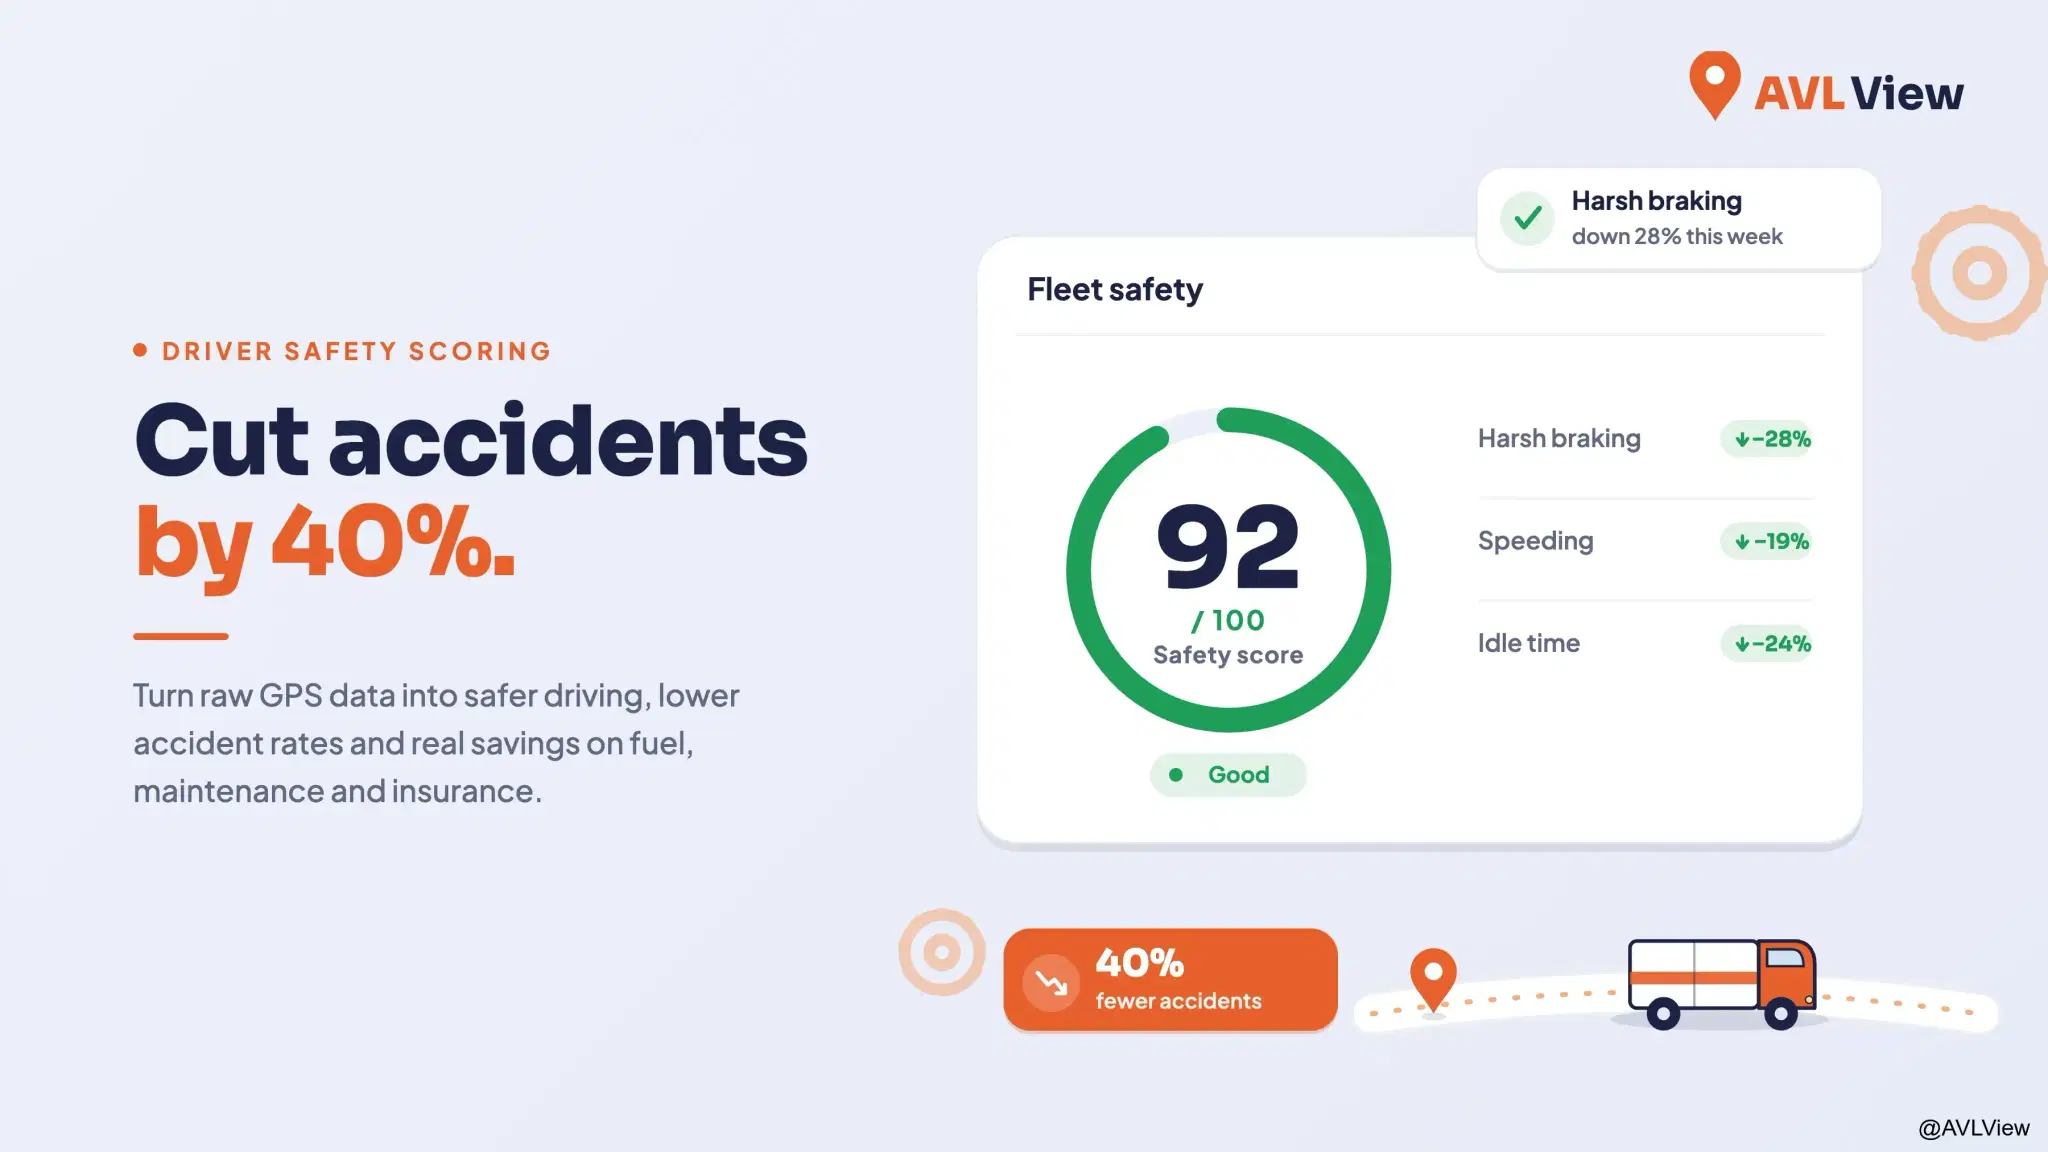
The Complete Guide to Driver Safety Scoring Systems
Learn how driver safety scoring systems work, how they reduce accidents by 40%, lower insurance premiums, and improve driving behaviour.
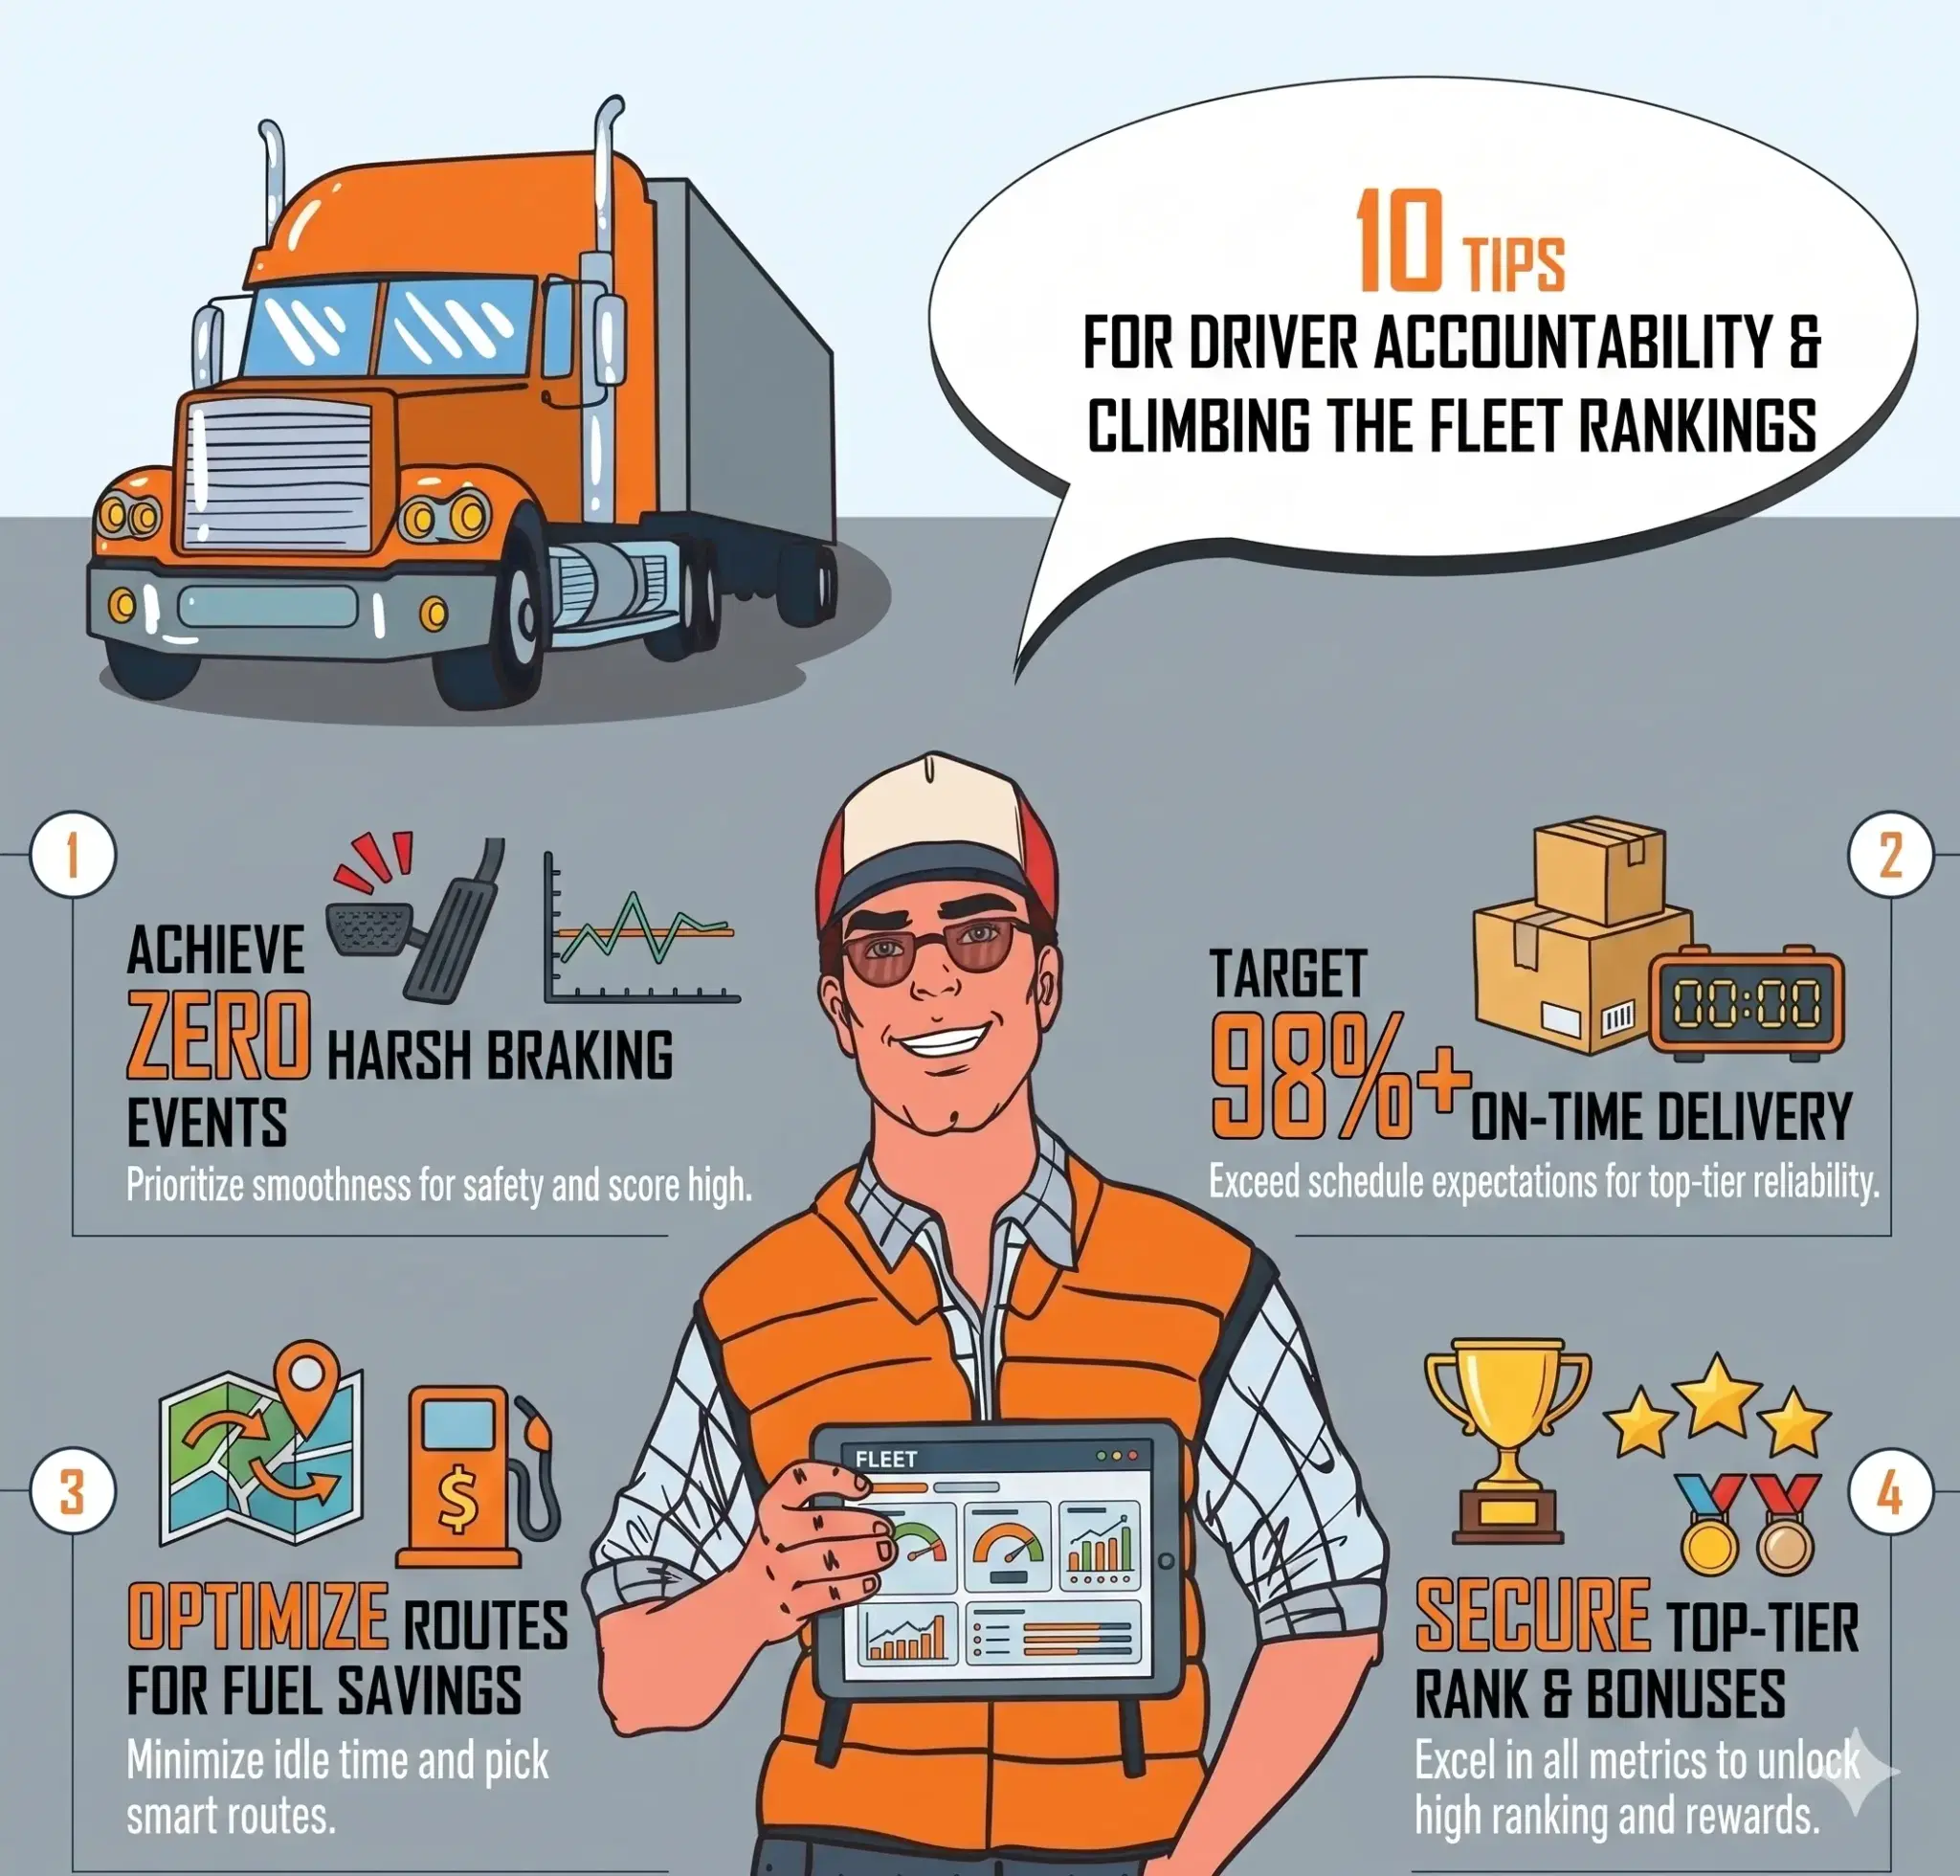
Driver Accountability: How Rankings Build Visibility and Healthy Competition
Rankings turn raw driving data into visible, comparable performance. See how safety scores, league tables, and trend tracking build accountability across your fleet.
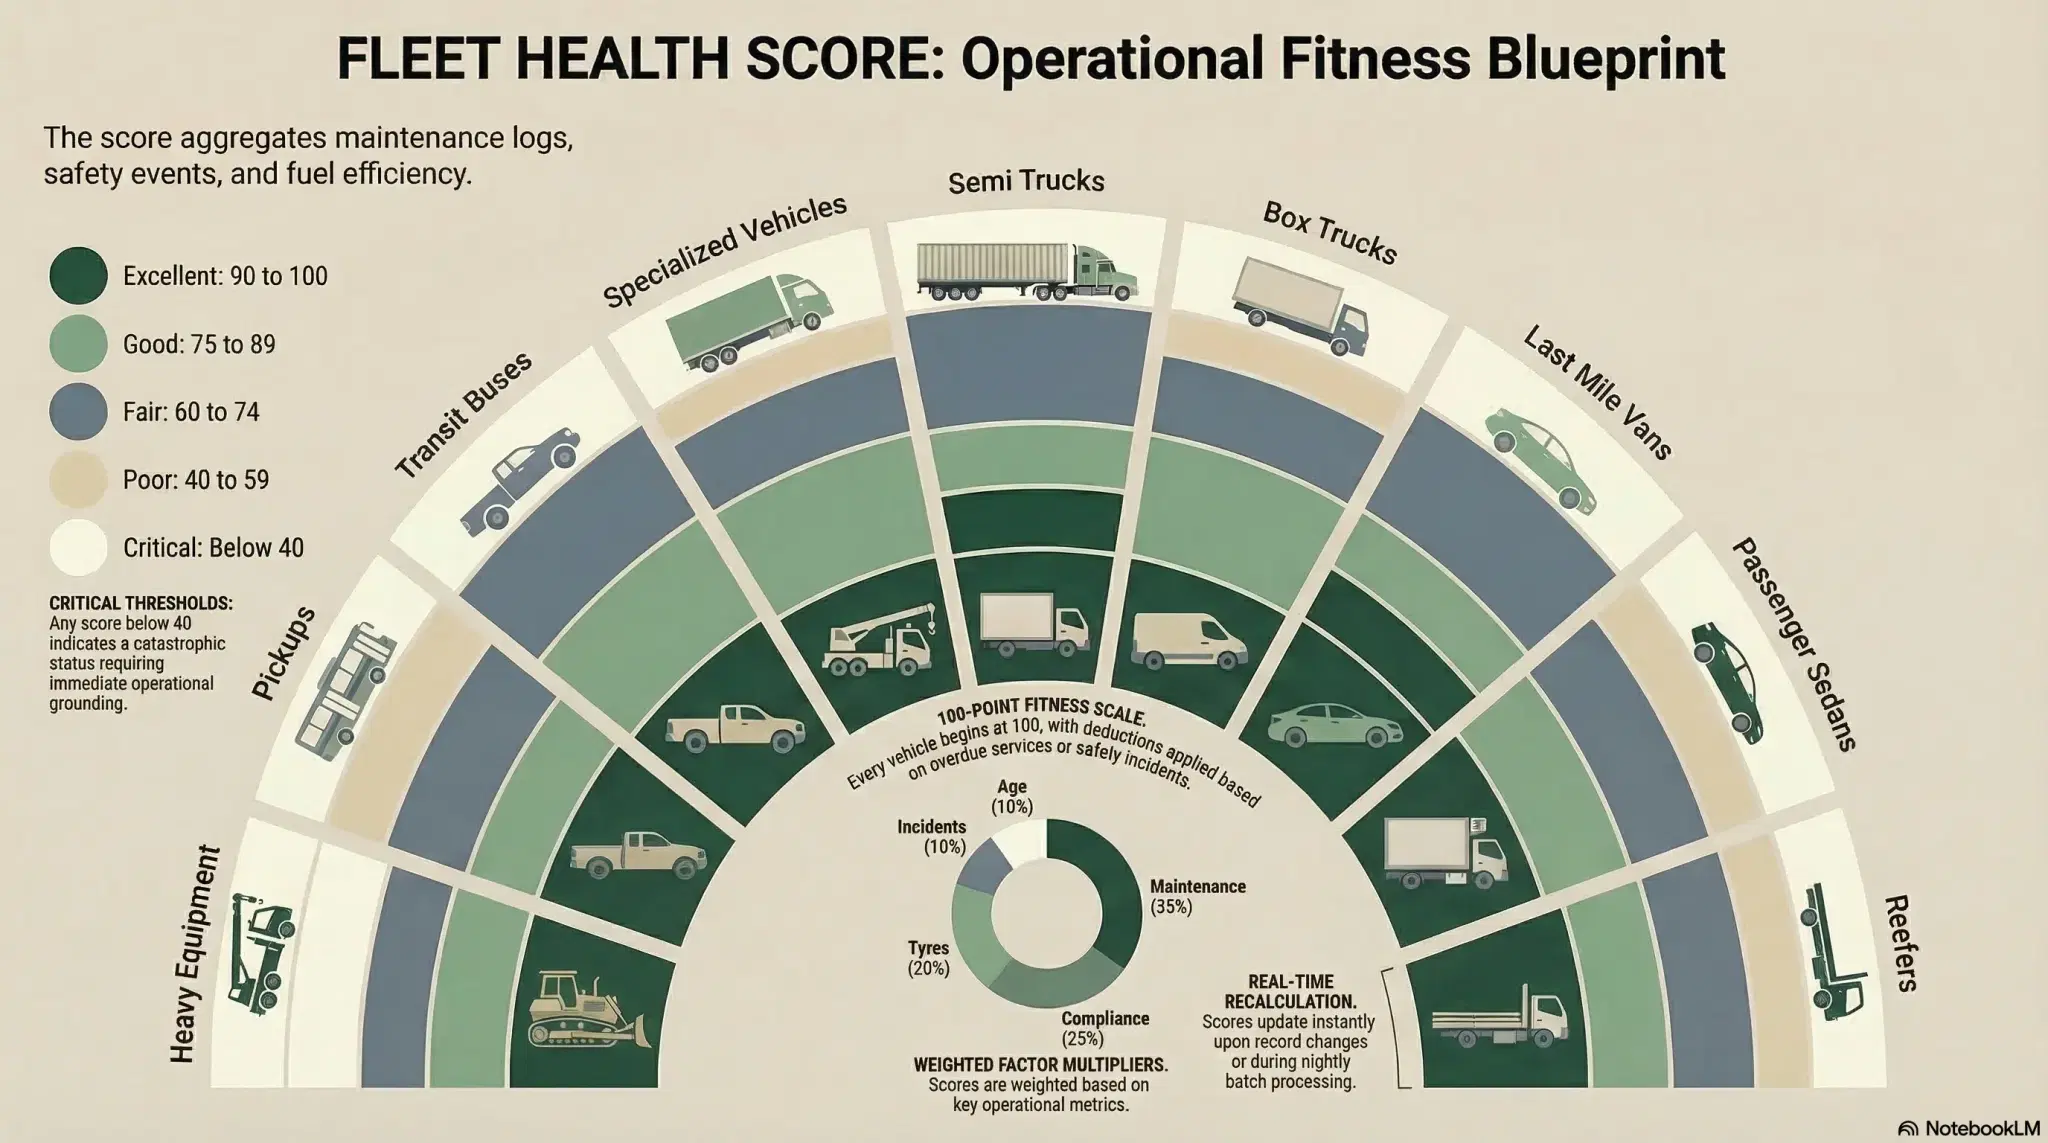
Fleet Health Score: One Number Per Vehicle
A single 0-100 fleet health score per vehicle replaces guesswork with clarity. Know exactly which vehicles need attention and why.
Join 43,000+ Fleet Owners Who Trust AVLView
AVLView helps you:
- Cut fuel costs by 8-15% within 90 days
- Improve driver safety and reduce accidents by 40%
- Get real-time visibility into every vehicle 24/7
- Automate reporting and save 10+ hours per week
- 30-day pilot program with no long-term commitment