Fleet Health Score: One Number Per Vehicle

What You'll Learn
A single 0-100 fleet health score per vehicle replaces guesswork with clarity. Know exactly which vehicles need attention and why.
Best for:
Logistics & Delivery professionals and fleet managers
What Is a Fleet Health Score?
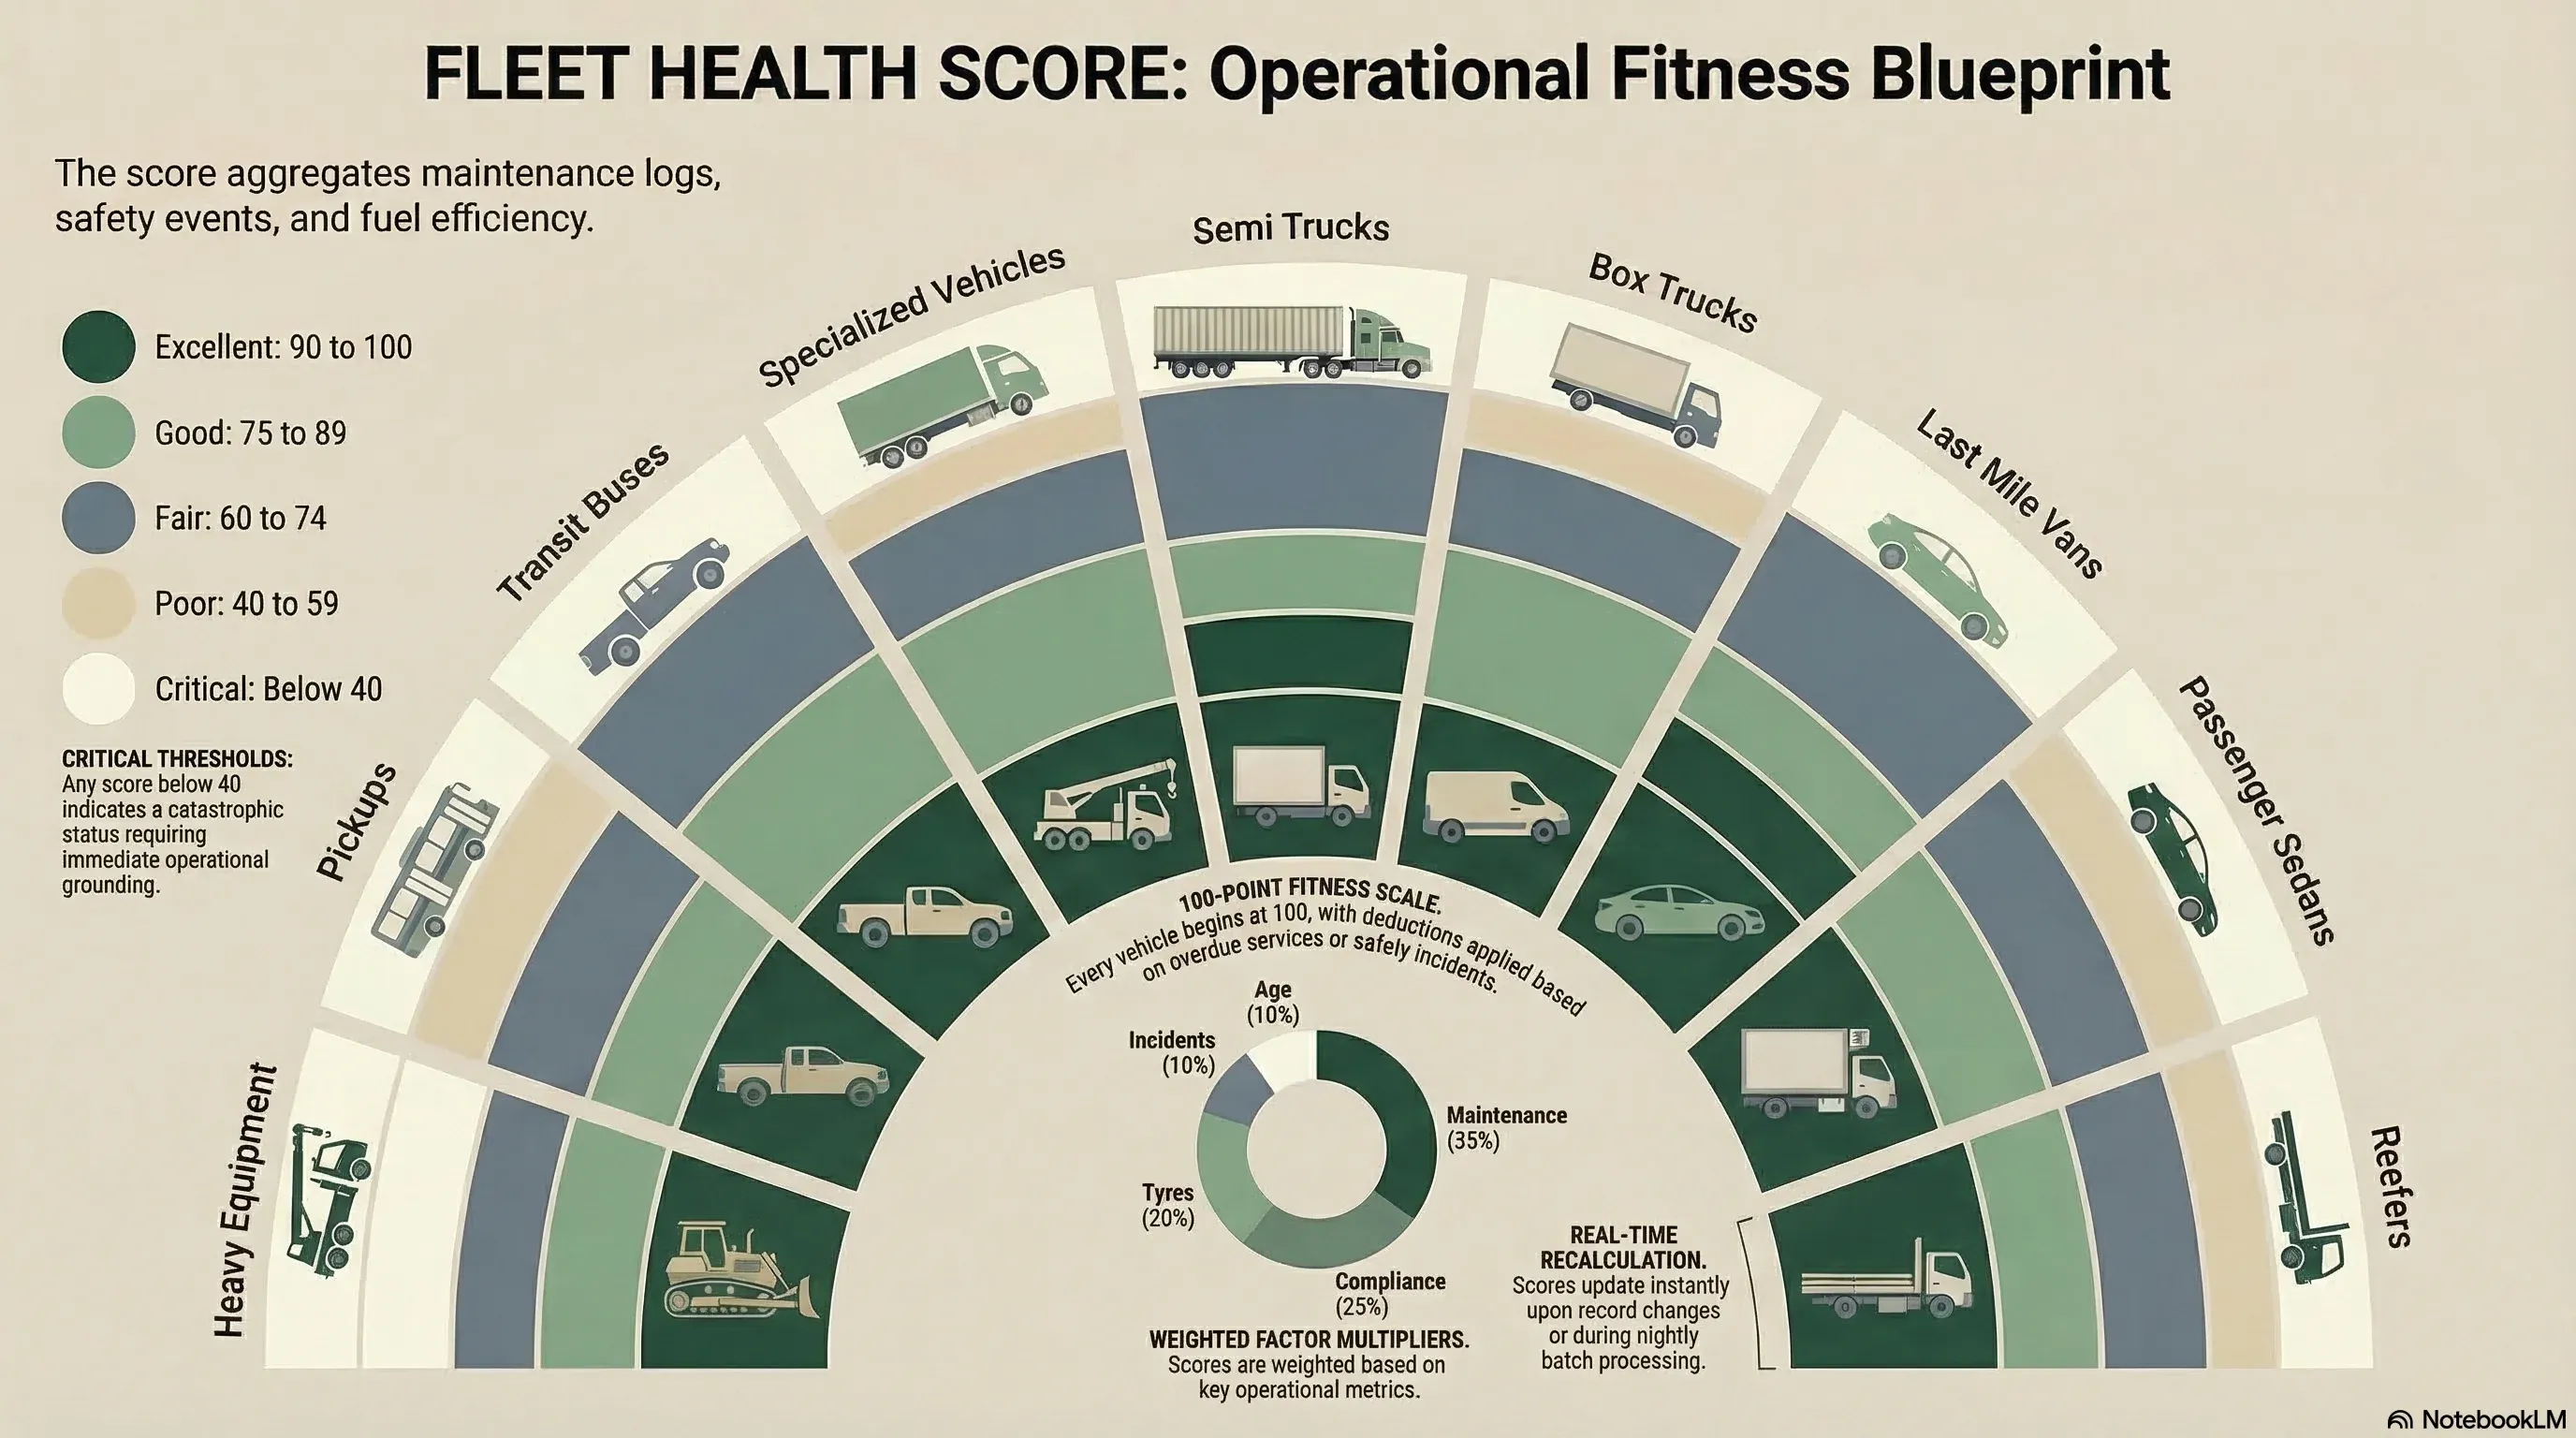
A fleet health score is a single number — 0 to 100 — assigned to every vehicle in your fleet. It reflects operational fitness across five factors that actually matter: maintenance, compliance, tyres, incidents, and vehicle age.
No opinions. No guesswork. Just data, weighted and scored.
The fleet-level score is the simple average of all vehicle scores. One glance tells you if your fleet is healthy, fair, or critical.
Why Fleet Operators Need a Vehicle Health Score
You have 50 vehicles. Maybe 200. Each one has a maintenance history, compliance documents, tyre records, and incident reports scattered across spreadsheets, folders, and someone's memory.
When a manager asks "how's the fleet doing?" — you hesitate. Because the honest answer is: you're not entirely sure.
That's the gap a fleet health score fills. It takes scattered data and turns it into one actionable number per vehicle.
Fleet operators who implemented health scoring typically see a 20–30% reduction in unplanned breakdowns within the first quarter. The reason is simple: problems become visible before they become emergencies.
The Five Factors Behind the Score
Every vehicle is evaluated on five dimensions. Each carries a specific weight based on its real-world impact.
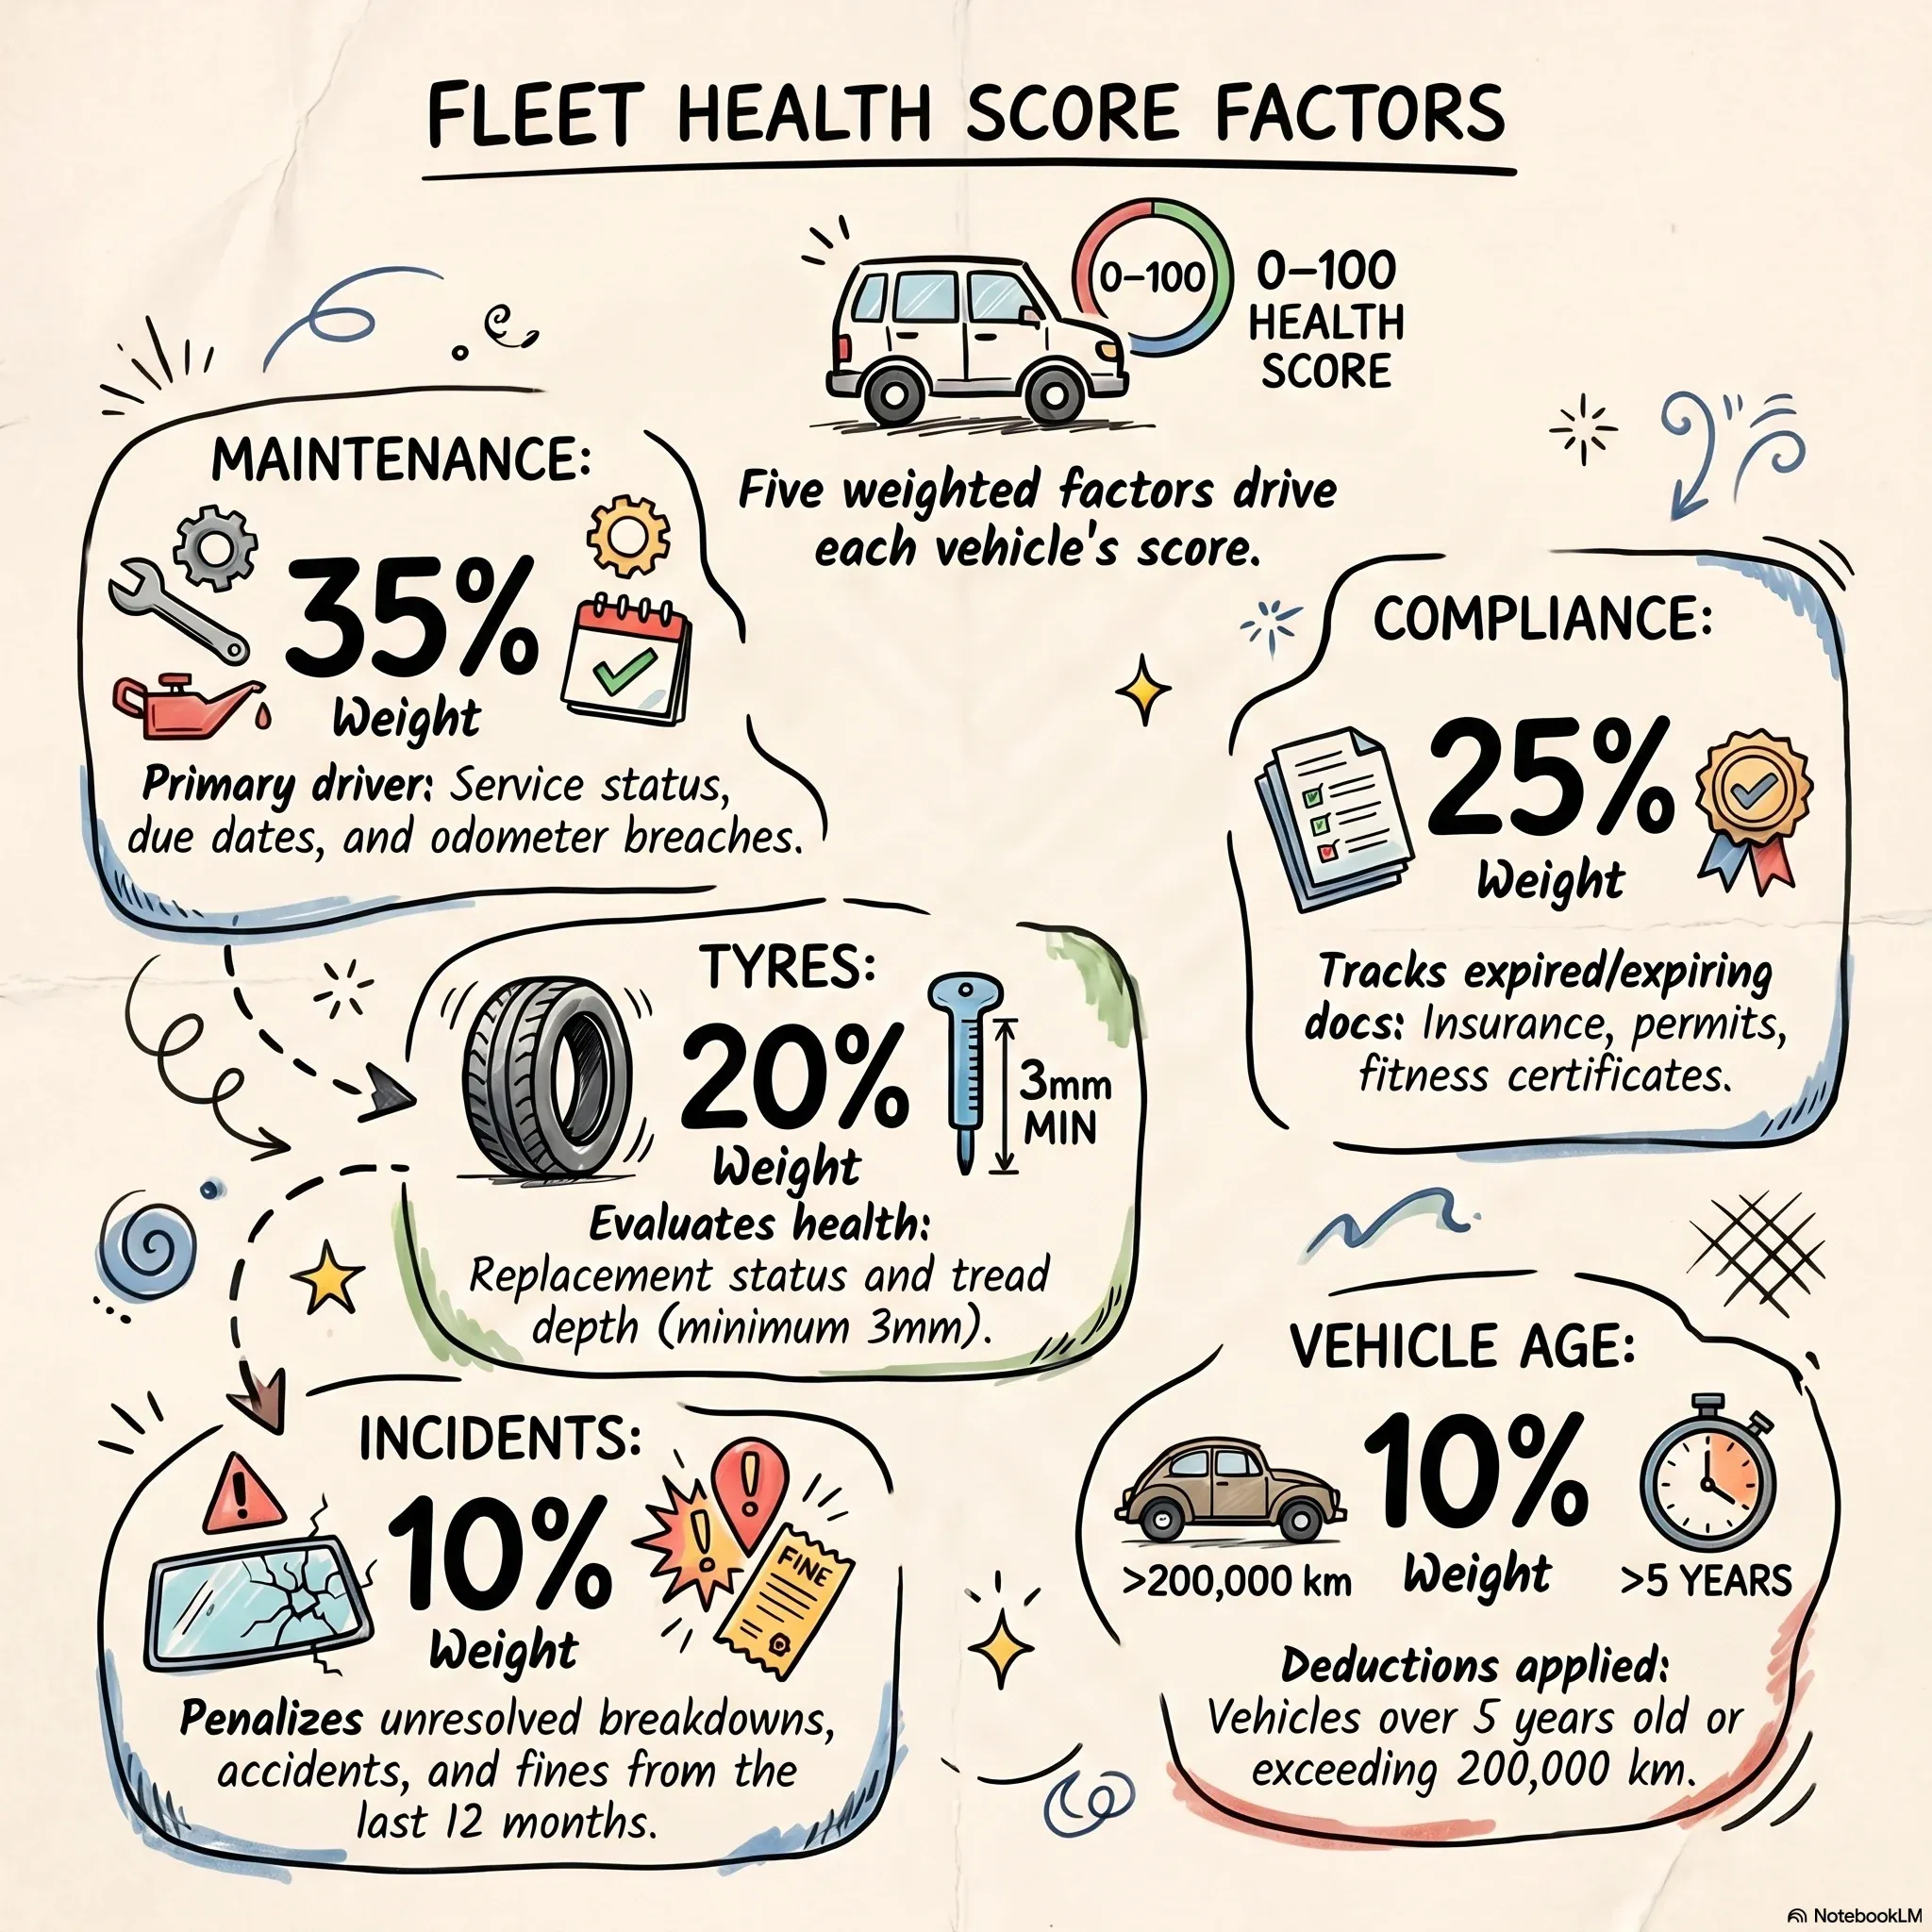
Maintenance (35%)
This is the heaviest factor. Overdue services and pending maintenance are the number one cause of unexpected breakdowns.
A vehicle with an overdue service takes a significant hit. One with a pending task gets a smaller deduction. The system checks both date-based and odometer-based schedules.
Compliance (25%)
Expired insurance, lapsed permits, overdue fitness certificates — these aren't just operational risks. They're legal liabilities.
Each expired document drops the score sharply. Documents expiring within 30 days trigger a smaller warning deduction.
Tyres (20%)
Worn tyres are a safety hazard and a fuel efficiency drain. The score evaluates tyre status and tread depth.
A tyre flagged for replacement hits hardest. Low tread depth without a replacement flag still triggers a deduction. Commercial vehicles with 6–18 tyres can see raw scores drop dramatically — the system handles this with a floor clamp so tyres alone can't tank the entire score.
Incidents (10%)
Unresolved breakdowns, accidents, and fines within the last 12 months count against the vehicle. Repeat incidents of the same type escalate progressively.
A first unresolved breakdown deducts from the score. A second deducts more. A third even more. This ensures chronic problem vehicles surface clearly.
Vehicle Age (10%)
Older and high-mileage vehicles naturally carry more risk. Each year beyond five years adds a small penalty. High-odometer vehicles take additional deductions.
This factor has the highest floor — age alone can never make a vehicle score catastrophic.
A Real Example
Meet Vehicle KA-01-1234, a delivery truck in a 120-vehicle fleet.
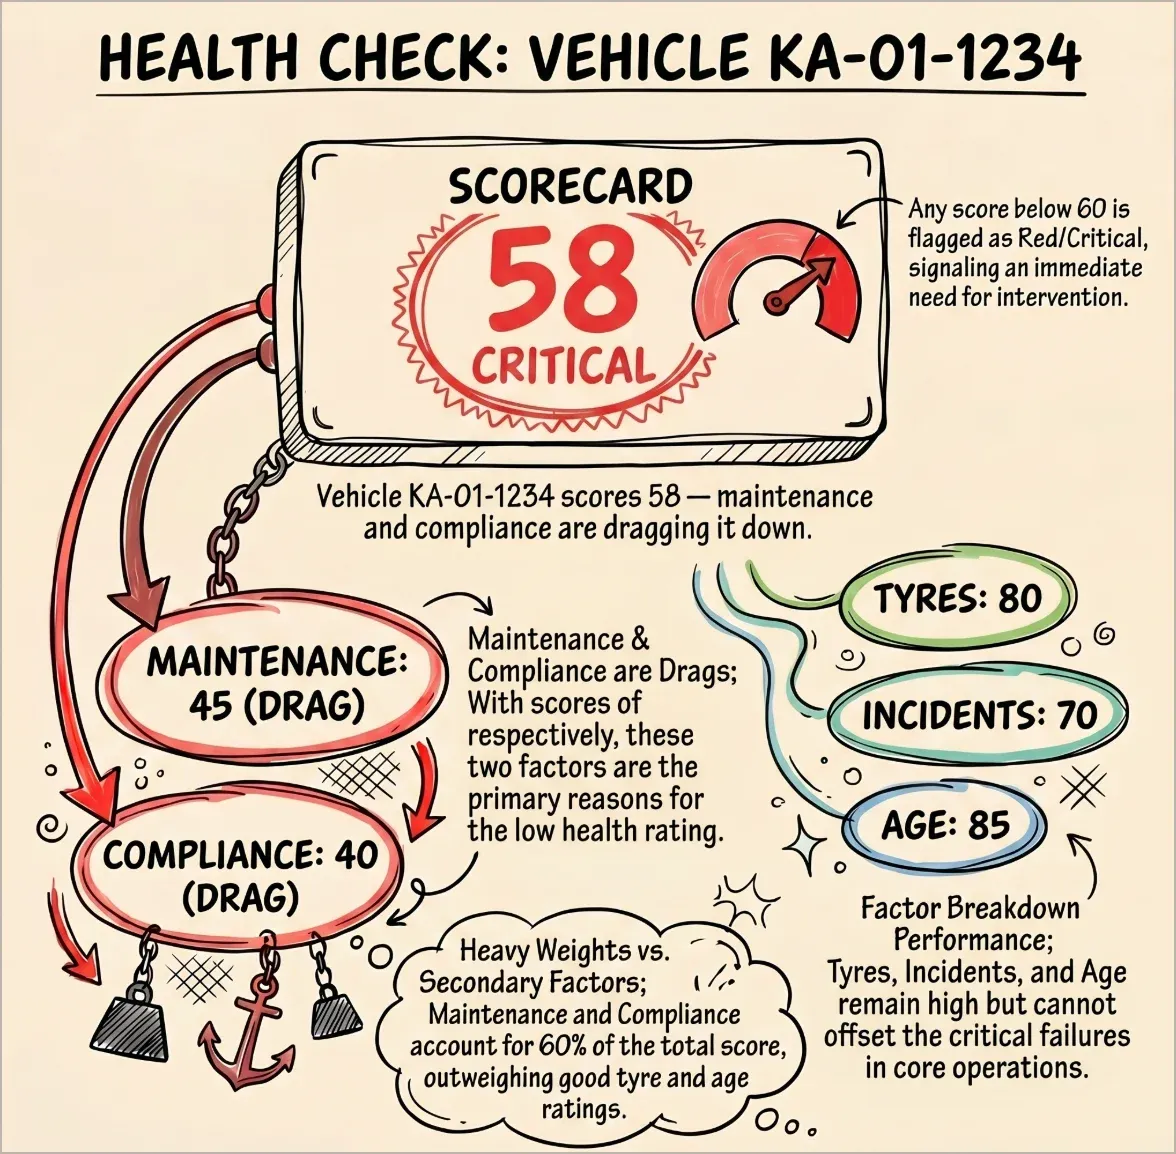
Health Score: 58 (Critical)
| Factor | Score | Issue |
|---|---|---|
| Maintenance | 45 | Oil service overdue by 12 days |
| Compliance | 40 | Insurance expired 3 days ago |
| Tyres | 80 | All tyres in good condition |
| Incidents | 70 | One unresolved fine from last month |
| Age | 85 | 7 years old, 180,000 km |
Without the health score, this vehicle looks fine on the surface — it's running daily routes with no complaints. But the data tells a different story: overdue maintenance plus expired insurance means it's one breakdown away from being both unsafe and uninsured.
The fleet manager spots it immediately, schedules the service, and renews the insurance. Score recovers to 82 within a week.
How to Read the Fleet Health Score
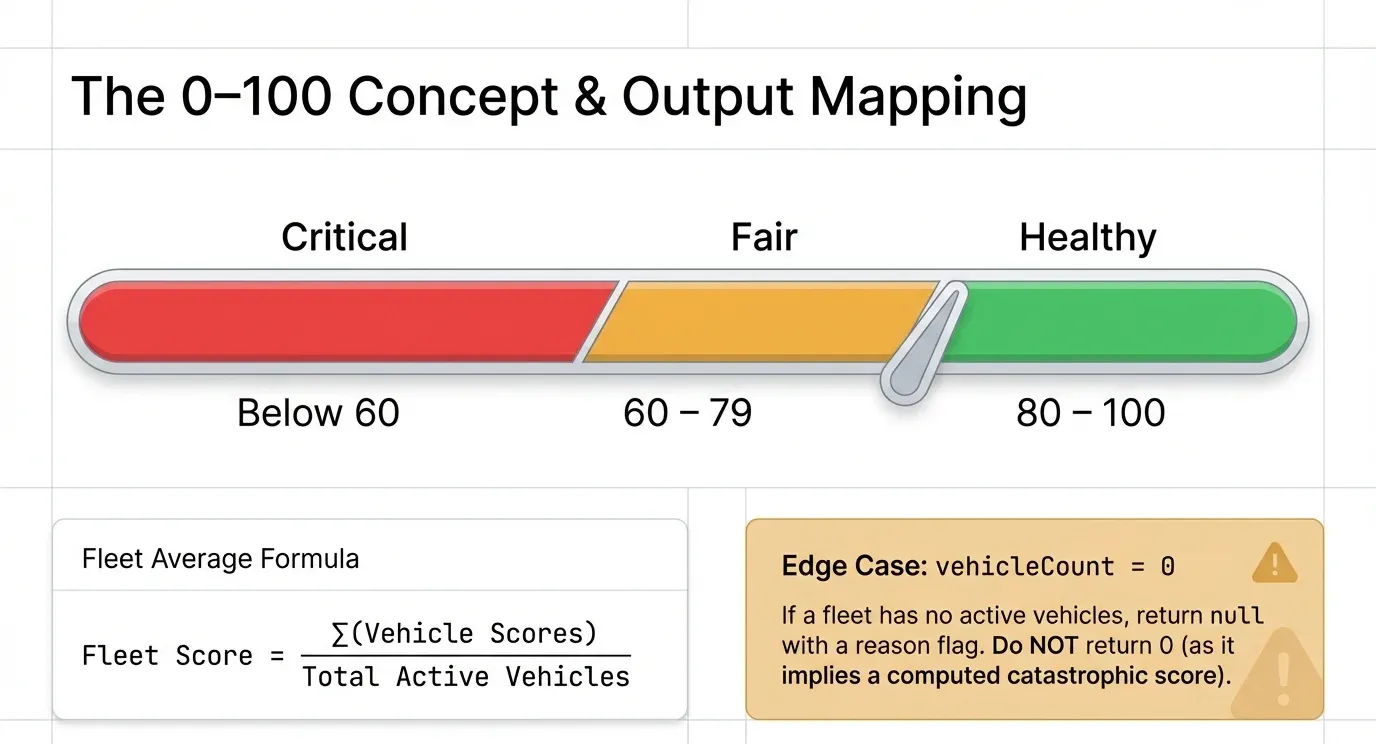
The scoring system uses three colour bands:
- 80–100 (Green): Healthy. The vehicle is in good operational shape.
- 60–79 (Amber): Fair. There are items that need attention soon.
- Below 60 (Red): Critical. Immediate action required.
Beyond the top-level number, each vehicle shows a breakdown by factor. You can see exactly which area is dragging the score down — maintenance, compliance, tyres, incidents, or age.
Sort your fleet by health score. The worst-scoring vehicles float to the top. The factor breakdown tells you exactly what to fix.
Handling New Vehicles and Missing Data
A vehicle onboarded less than 30 days ago with no incidents scores 100 — but receives a low confidence flag. The system is transparent about insufficient history.
Vehicles missing records in certain areas receive default scores rather than full marks. No maintenance logs? The score drops to 60 for that factor. Missing data is not the same as clean data.
This matters because fleets that import vehicles from another system often have gaps. The confidence flag tells you where you need more data before trusting the number.
Real-Time Updates, Not Stale Reports
The fleet health score updates in two ways.
First, it recalculates immediately whenever a relevant record changes — a service is completed, a document expires, a tyre is replaced, an incident is resolved.
Second, a nightly batch job catches time-based changes that don't trigger events — like a compliance document expiring at midnight.
The result: your dashboard always reflects the current state. No waiting for weekly reports or manual recalculations.
Turn Your Fleet Health Score Into Action
Without a health score, fleet managers react to problems after they become emergencies. With one, patterns become visible before they become costly.
One AVLView client — a logistics fleet of 85 vehicles in the UAE — reduced unplanned breakdowns by 35% in the first three months after implementing health scores. Their maintenance team stopped firefighting and started planning.
The confidence flag tells you where you need more data. The factor breakdown tells you exactly what to fix. And the colour bands give you instant fleet-wide visibility.
It replaces daily guesswork with a system that gets smarter as your data improves.
Start tracking your fleet's health score with AVLView
FAQ
What data does the fleet health score use?
The score pulls from five data sources: maintenance records, compliance documents, tyre records, incident reports, and vehicle registration details (year and odometer). All data comes from records already in the system — no manual input required.
How often is the fleet health score updated?
The score updates in real-time whenever a relevant record is created, updated, or deleted. A nightly batch job also runs to catch time-based changes like expiring documents.
What happens if a vehicle has no maintenance records?
Vehicles with missing records receive conservative default scores rather than full marks. No maintenance records results in a score of 60 for that factor — the system treats missing data as a risk signal, not a clean bill of health.
Can the health score help prioritize vehicle servicing?
Yes. Sorting vehicles by health score surfaces the ones in worst condition. The factor breakdown shows exactly what's driving the low score, so maintenance teams can prioritize the right actions instead of guessing.
What does low confidence mean on a health score?
Low confidence means the system doesn't have enough data for a reliable assessment — either the vehicle was onboarded recently (under 30 days) or multiple data sources are missing. The score is still calculated but should be interpreted with that context.
Ready to Transform Your Fleet Operations?
See how AVLView helps fleet managers like you cut costs, improve safety, and boost efficiency with real-time GPS tracking.
Frequently Asked Questions
What is a fleet health score?
▼
How often should fleet health scores be updated?
▼
What factors affect the fleet health score?
▼
Can fleet health scores reduce maintenance costs?
▼
Related Articles

How Drivers Block or Cheat GPS Trackers: 9 Tricks and How to Catch Every One
From foil wrapping to plug-in jammers, here are the 9 tricks drivers use to defeat vehicle trackers — and the alerts that catch every one.

GPS Tracking vs Telematics: What's the Difference — and Which Does Your Fleet Need?
GPS tracking answers where your vehicles are. Telematics answers how they're running, burning fuel and being driven. Here's how to choose.

Stop Staring at Maps — Let Trip Anomaly Detection Do the Work
Most GPS tracking tools show you where vehicles are, but not what
Join 43,000+ Fleet Owners Who Trust AVLView
AVLView helps you:
- Cut fuel costs by 8-15% within 90 days
- Improve driver safety and reduce accidents by 40%
- Get real-time visibility into every vehicle 24/7
- Automate reporting and save 10+ hours per week
- 30-day pilot program with no long-term commitment