Enhanced Report and MapView Module
Ver. 7.1
We are happy to announce the release of the latest version 7.1. It comes with many significant improvements for Reports, Mapview and Alerts modules.
We have some exciting news!
The reports generation has become a whole lot faster. Reports grid will load data before you can snap and would take you fewer clicks to sort, filter, drag/drop and finally to generate a summary of the report.
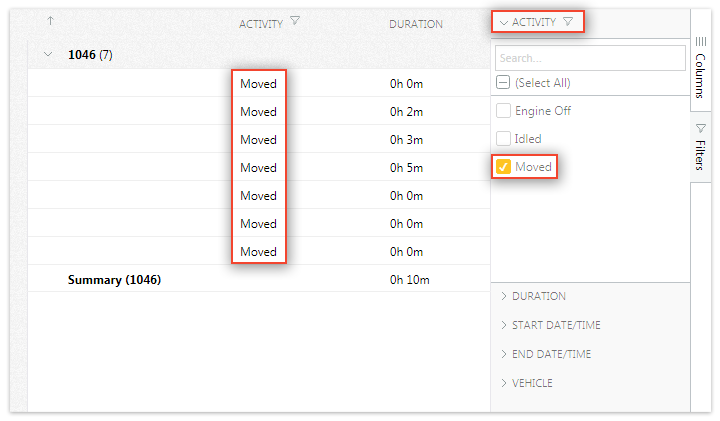
Reports -> Filter
You may filter a column and re-generate the report as required.
E.g., On a Daily activity report, you have three activity types under the “Activity” column viz., Engine Off, Idled and Moved. You may opt to show/hide any of these types as you would like to see on a report.
Reports -> Group
You may group the entities on the report grid based on multiple criteria, such as vehicle, date, events.
And each group entity shall have a Summary.
In addition, you can format the report grid viz.,
- Pin columns.
- Do Value Aggregation (eg: SUMMARY).
- Drag and move a column to left or right.
- Autosize All/Specific columns.
- Expand/Collapse the Summary.
Reports -> Drag & drop
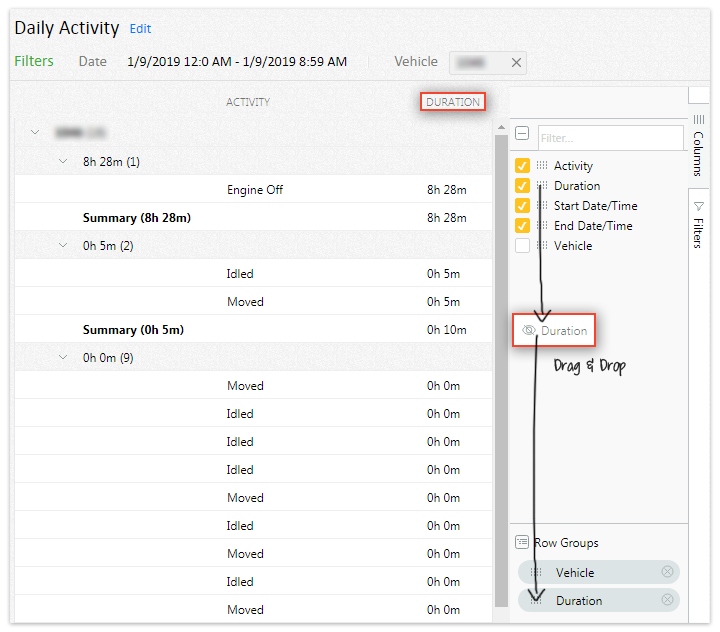
In response to a number of requests, we added a feature that helps one to drag and drop the desired columns in the report grid.
As shown in the image below; ‘Group’ is dragged under Row Groups. The entire Report will now be sorted based on these two selected columns namely ‘Vehicle’ and ‘Group’.
Reports -> View archives
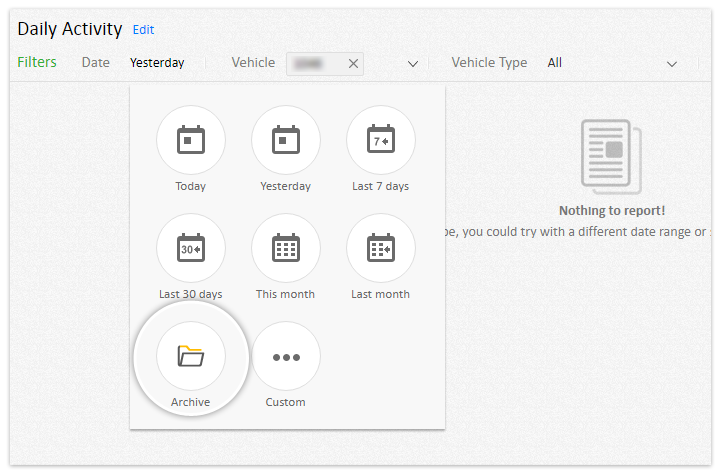
For those of you who frequently search through past archived data, would find it easy now.
Reports -> Chart -> Water level
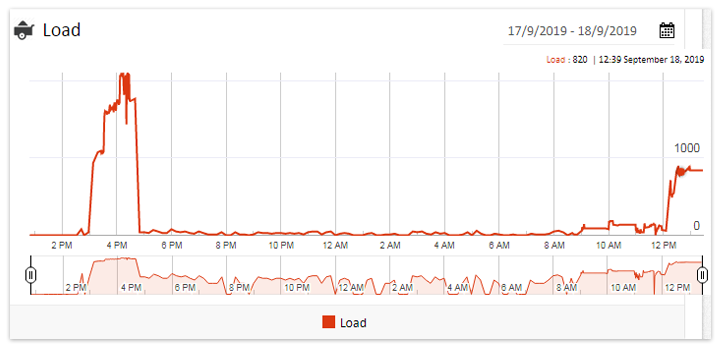
Reports -> Chart -> Truck cargo load
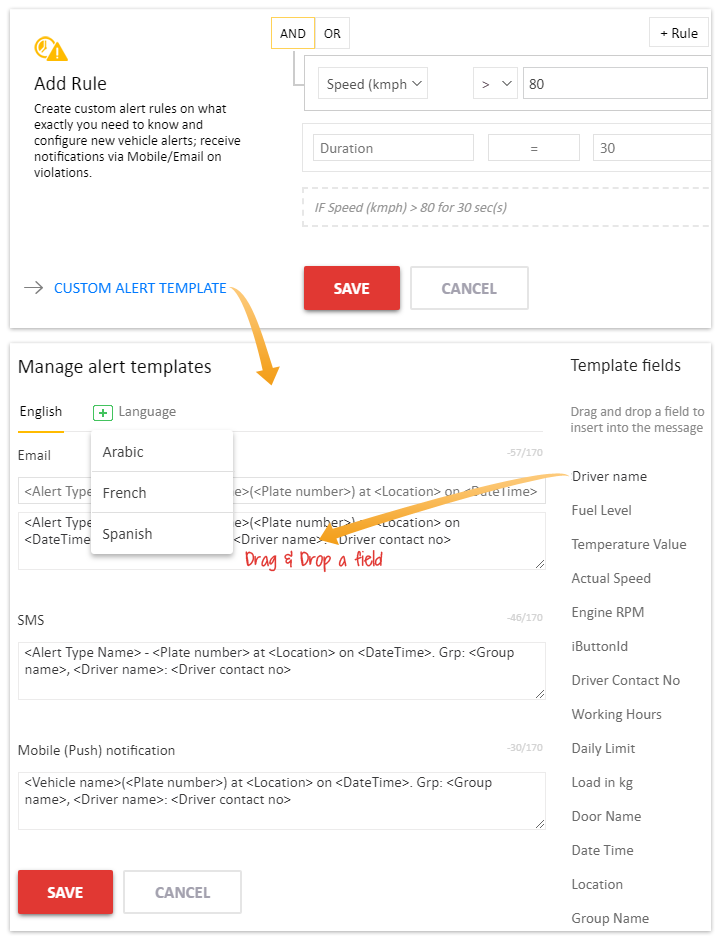
Alerts -> Create template
All these days you were receiving alerts in a predetermined format, the improved alert module allows you to create a template of your choice.
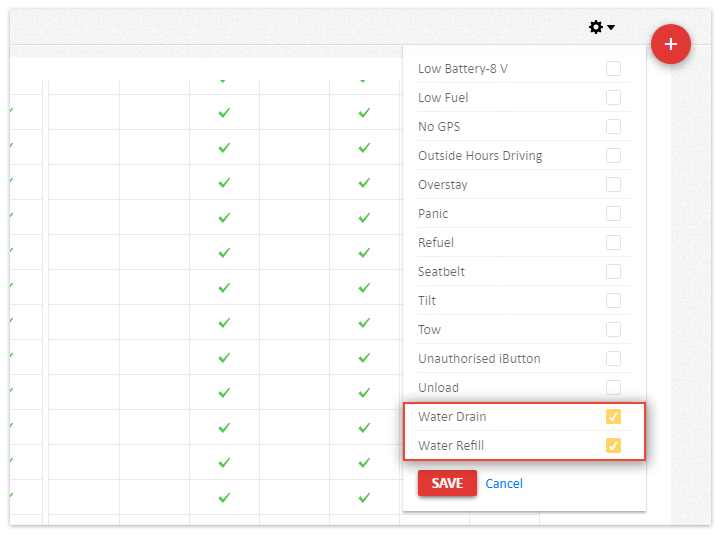
Alerts -> Water Refill/Drain
This is mainly aimed at fleet operators who have fleet ferrying water. Alerts can be generated on every water drain and refill.
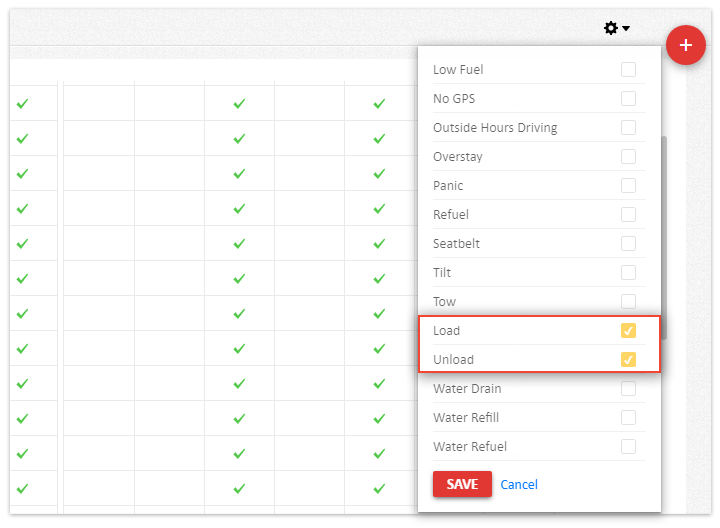
Alert -> Loading/unloading
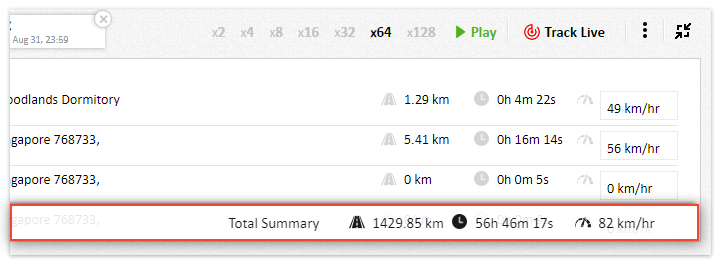
MapView -> Track Summary
It is an easy way for you to have a glance at the past trips along with fleet metrics such as Distance covered, Hours plied and the maximum speed at which the vehicle was driven.
MapView -> Heat map
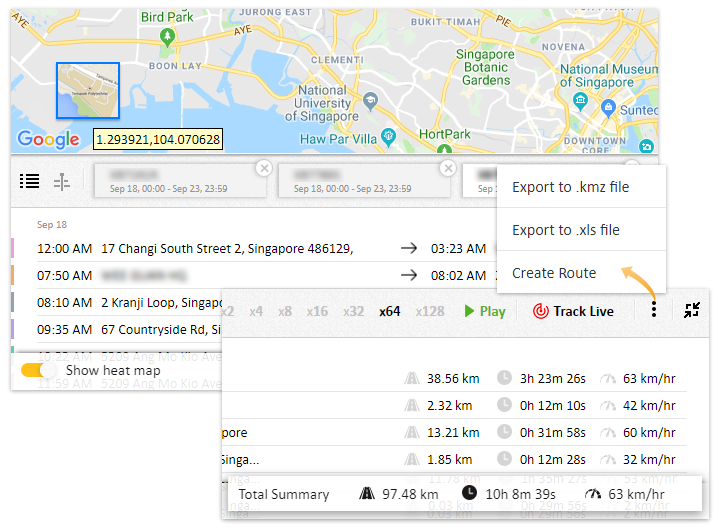
Generating a heatmap helps you understand fleet activity for the period chosen.
MapView -> Export tracks
Keeping a digital record of your Track data (historical data of all the trips) has become easy now with the option to export the same in kmz/xls format.
MapView -> Track counter
Now you can enable/disable viewing track number on geo-location markers.
![]()
ACTION: We’re going to be moving quickly from now on, so stay tuned to learn about upcoming product releases and training.
Help spread the word how the platform helped you transform your fleet operations by letting all your friends know about it.